A Guide to Google Search Console
Google Search Console is an indispensable tool to SEO professionals and anyone looking to optimize their website to get found on Google. Learn everything you ever wanted to know about Google Search Console and how to use it to improve your SEO results, including specific tactics and strategies that you can use to boost rankings.
What is Google Search Console?
Google Search Console is a free tool from Google that helps you monitor the health of your website through a wide variety of tools and reports. Formerly “Google Webmaster Tools”, this updated version is an essential tool in your SEO toolbox for just about every aspect of your website that will allow you to monitor and improve your SEO.
This extensive Google Search Console guide will:
- Help you figure out how to set up your own website in Google Search Console
- Provide you with ways to use Google Search Console to improve your keyword rankings, view website errors, monitor your website’s SEO, and much more
Why Use Google Search Console?
Google Search Console allows you to:
- Submit a sitemap to ensure all your web pages are discovered and indexed on Google
- Discover errors on your website that may be hurting your SEO ranking.
- Monitor your keyword ranking and whether your clicks are increasing or decreasing per keyword.
- Confirm that Google can access your website’s content.
- Submit your pages for faster crawling and indexing.
- Monitor malware warnings and file reconsideration requests
- Discover how your website is viewed by search engines.
- Determine which keywords your website currently ranks for
- Monitor your website page experience and usability.
- View your website’s internal and external links.
- Evaluate your website’s structured data.
How to Set up Google Search Console?
To start with, you will need to have a Google account to set up Google Search Console. If you’re already using a Google product – Google Ads, Google Analytics, Google Docs, Google Business Profile, formerly Google My Business, or a Gmail account – you should already have a Google Account.
I would recommend you use the same email address to set up all Google Products. This will make it easier for you to link between accounts and share data.
Here are the steps on how to create a Google Account:
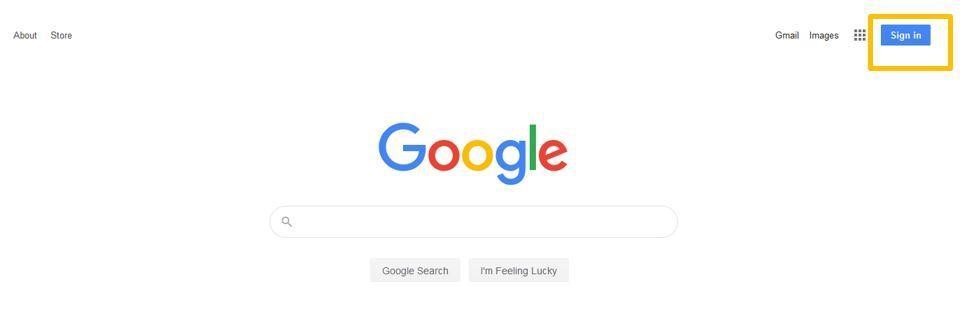
Step 1: Go to Google.com and click ‘sign in’ at the top right
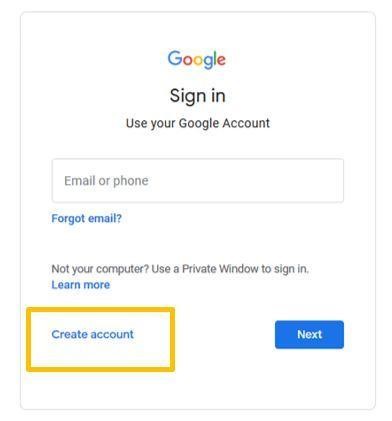
Step 2: Click ‘Create an account’
https://www.androidcentral.com/how-set-new-google-account
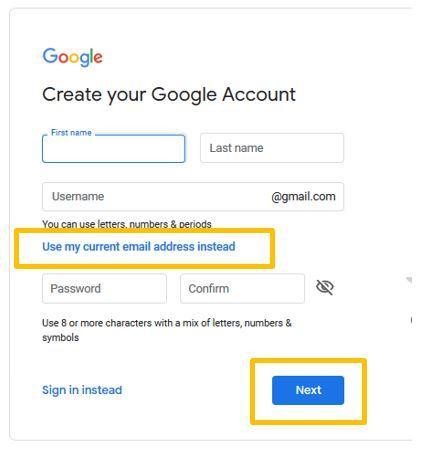
Step 3: You can choose to create a Gmail account or click ‘use my current email address instead’ to use an existing account, such as your work email. Then click ‘next’.
If you already have a Google account, or once you create a Google account, you’re ready to create a Google Search Console Account.
- Go to https://search.google.com/search-console/about
- Enter your email and password to log in
- Once you log in you will be asked to select a property type. If you would like to track all your URLs, select the domain option. If you would like to track specific URLs, choose the URL prefix option.
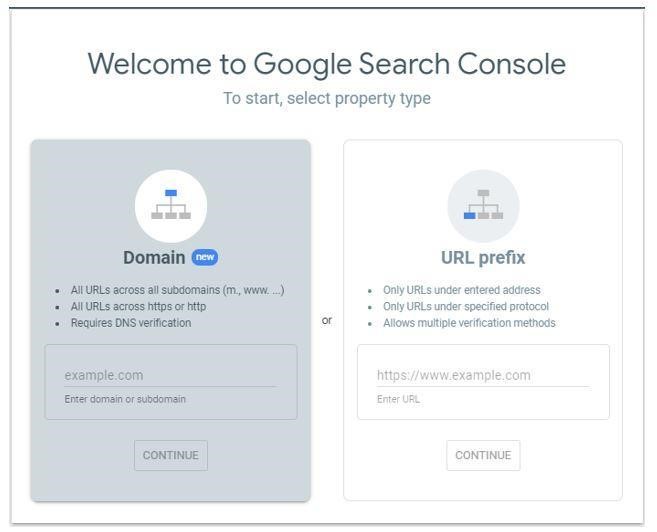
Steps to setting up Google Search Console via the Domain Option
- Enter your domain/website address and click continue. Pay attention to whether your website has the www version or the non-www version.
- Next sign into your domain provider e.g. GoDaddy
- Copy the TXT record provided into the DNS configuration.
- Return to Google Search Console to verify.
To setup Google Search Console via the URL Prefix option
- Enter your domain/website address and click continue. Pay attention to whether your website has the www version or the non-www version. Enter your full URL prefix e.g. (https://www.yoursite.com)
- You have several options to verify your website in GSC, simply click the down arrow next to each method.
- HTML file: download the HTML file provided and upload it to your website’s root directory
- HTML Tag: add a meta tag to your site’s homepage. Simply copy the meta tag provided and paste it into your site’s homepage
- Google Analytics: this is one of the easier options if you already have Google Analytics installed on your website. As long as you’re using the same email address for your Google Account you will be able to use this
Method.
When to use the Domain option:
- If you want to verify your entire domain, including all subdomains and protocols (HTTP/HTTPS).
- If you have a large website with many subdomains.
- If you want to make it easy to verify your website in the future, you will not need to add new verification codes each time you add a new subdomain.
When to use the URL Prefix option:
- If you only want to verify a specific URL prefix, such as https://www.yoursite.com.
- If you have a small website with only one subdomain.
- If you are having trouble verifying your website using the Domain option.
Link Google Analytics 4 with Google Search Console
In 2013, Google switched searches to HTTPS, claiming improved security.
The downside was that important keyword data disappeared from Google Analytics.
But now there is an easy way to retrieve some keyword data, by linking Google Analytics to GSC.
To link GSC to Google Analytics 4 to access keyword data, take the following steps:
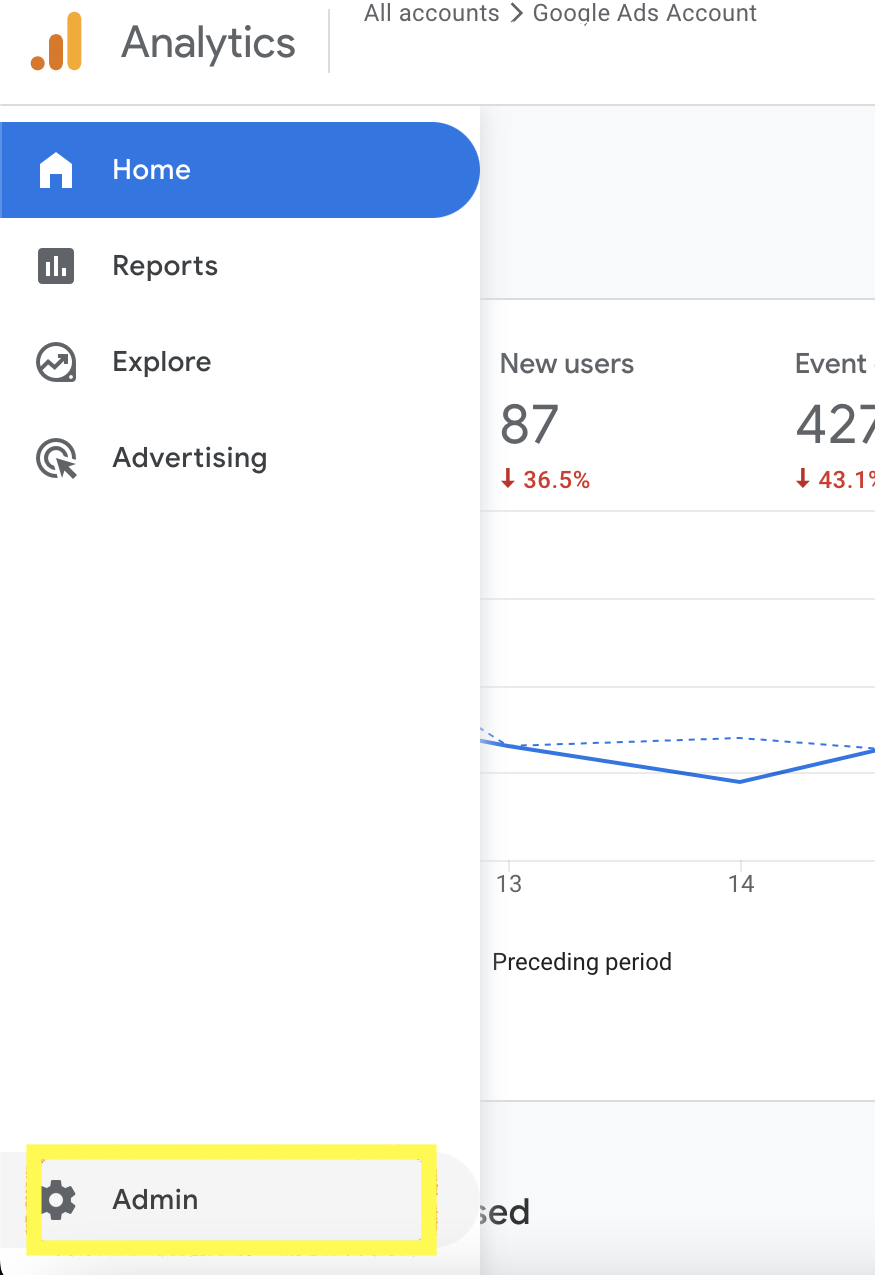
- Open up Google Analytics 4 and click the ‘Admin’ button on the bottom left
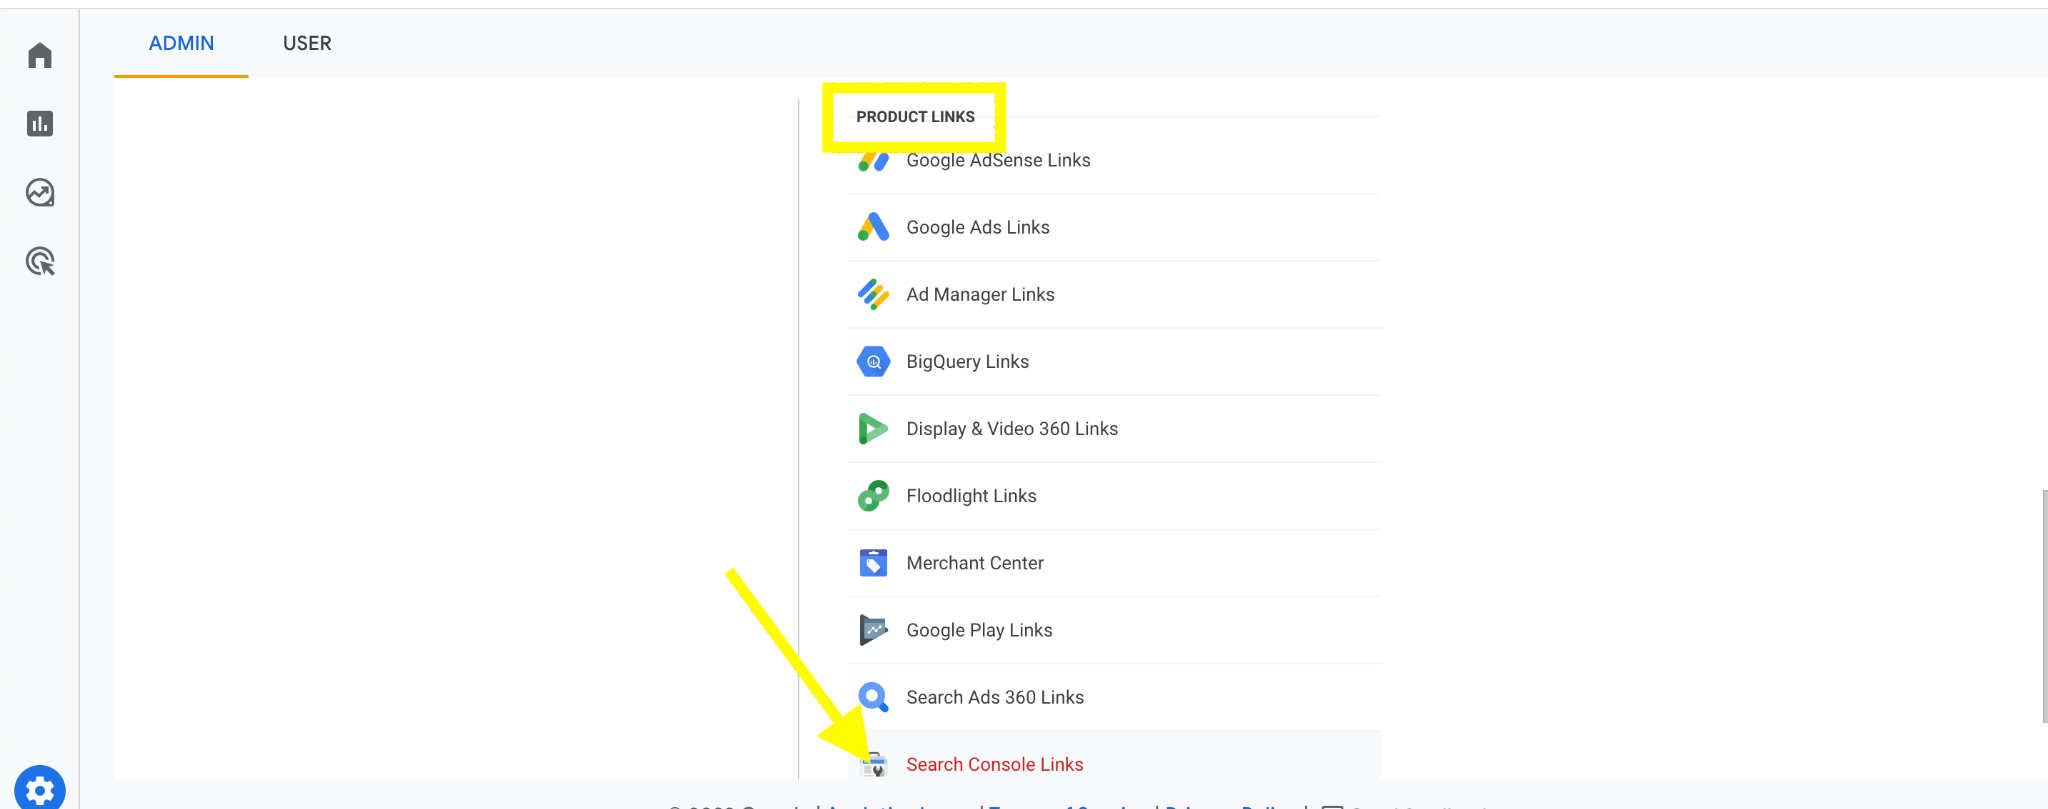
- Scroll to Product links by the right and click on Search Console links
2. Click on the blue link button to open up the configuration tab

3. Click on the ‘choose account’ button to select your search console property.
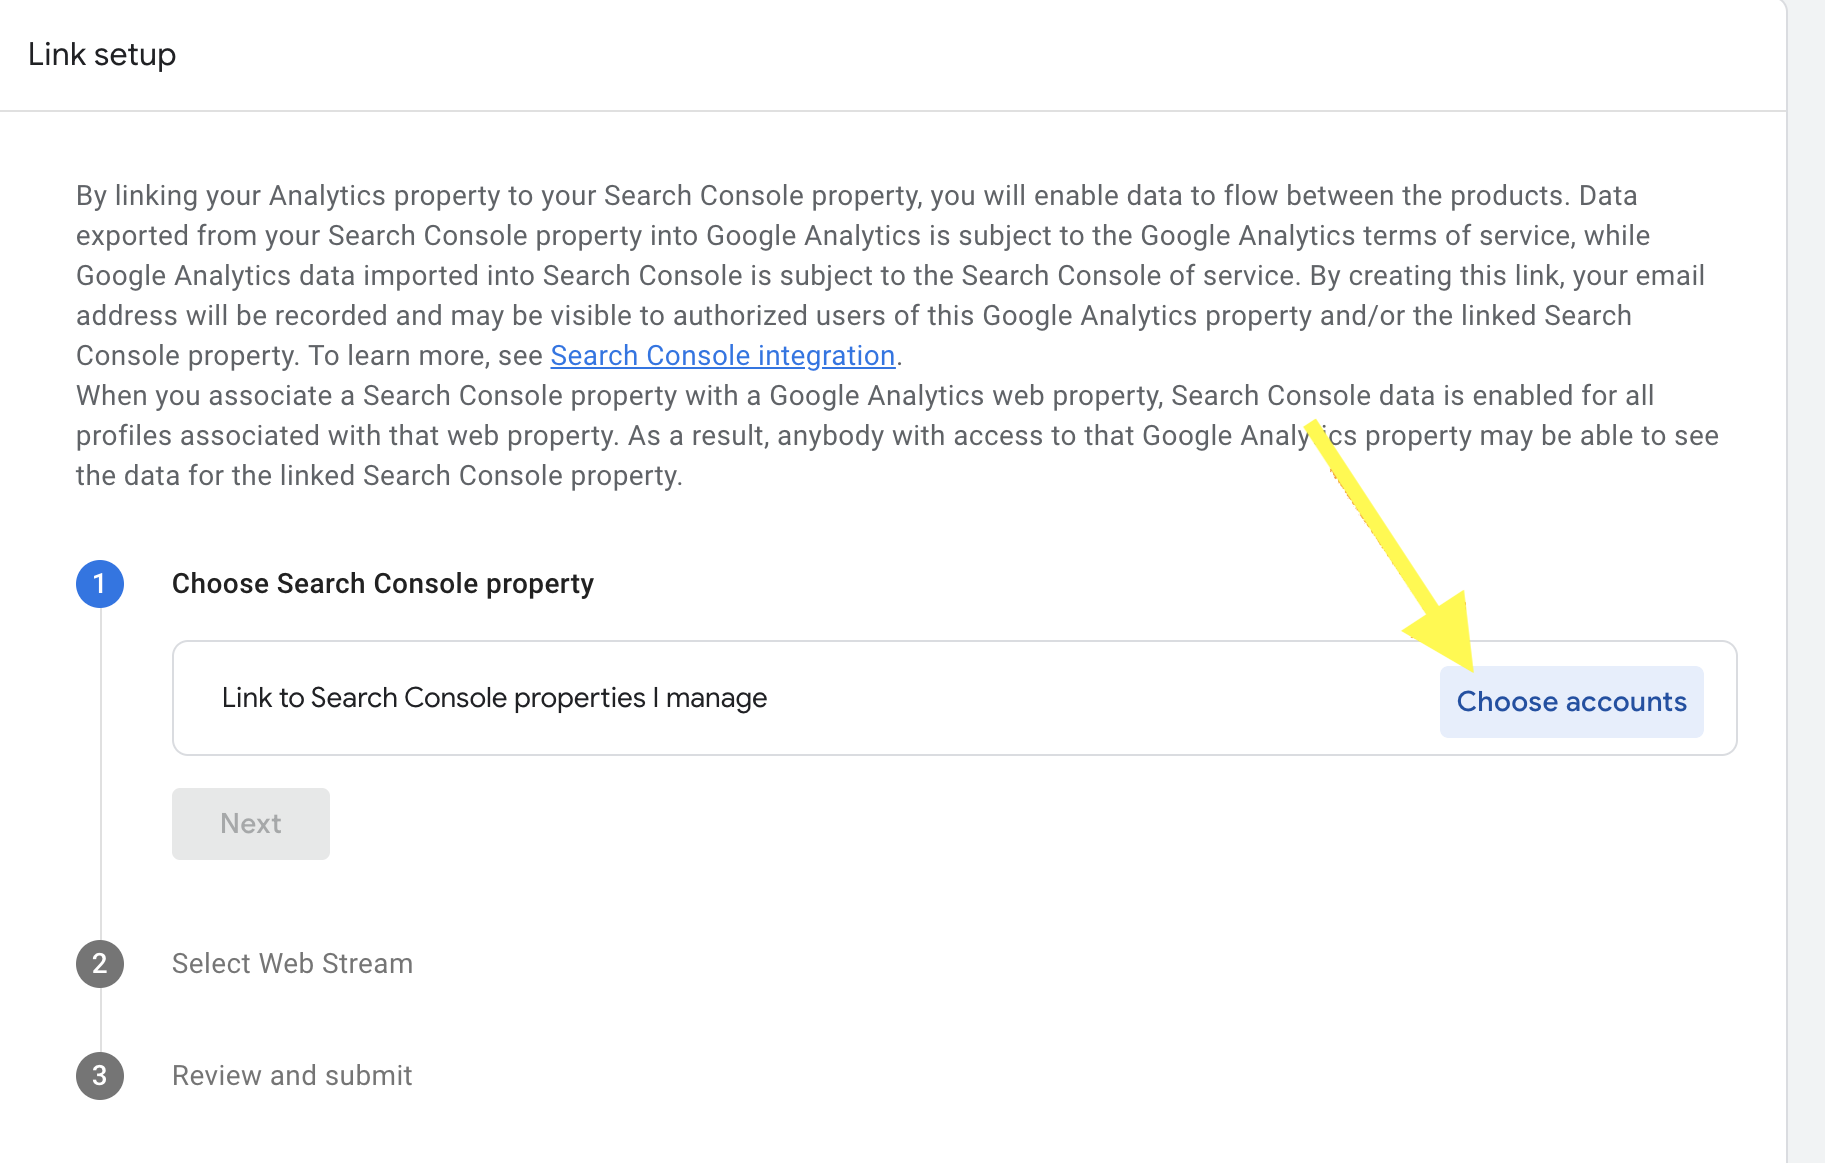
Select the correct account you want to link and click the confirm button.

click Next, to continue
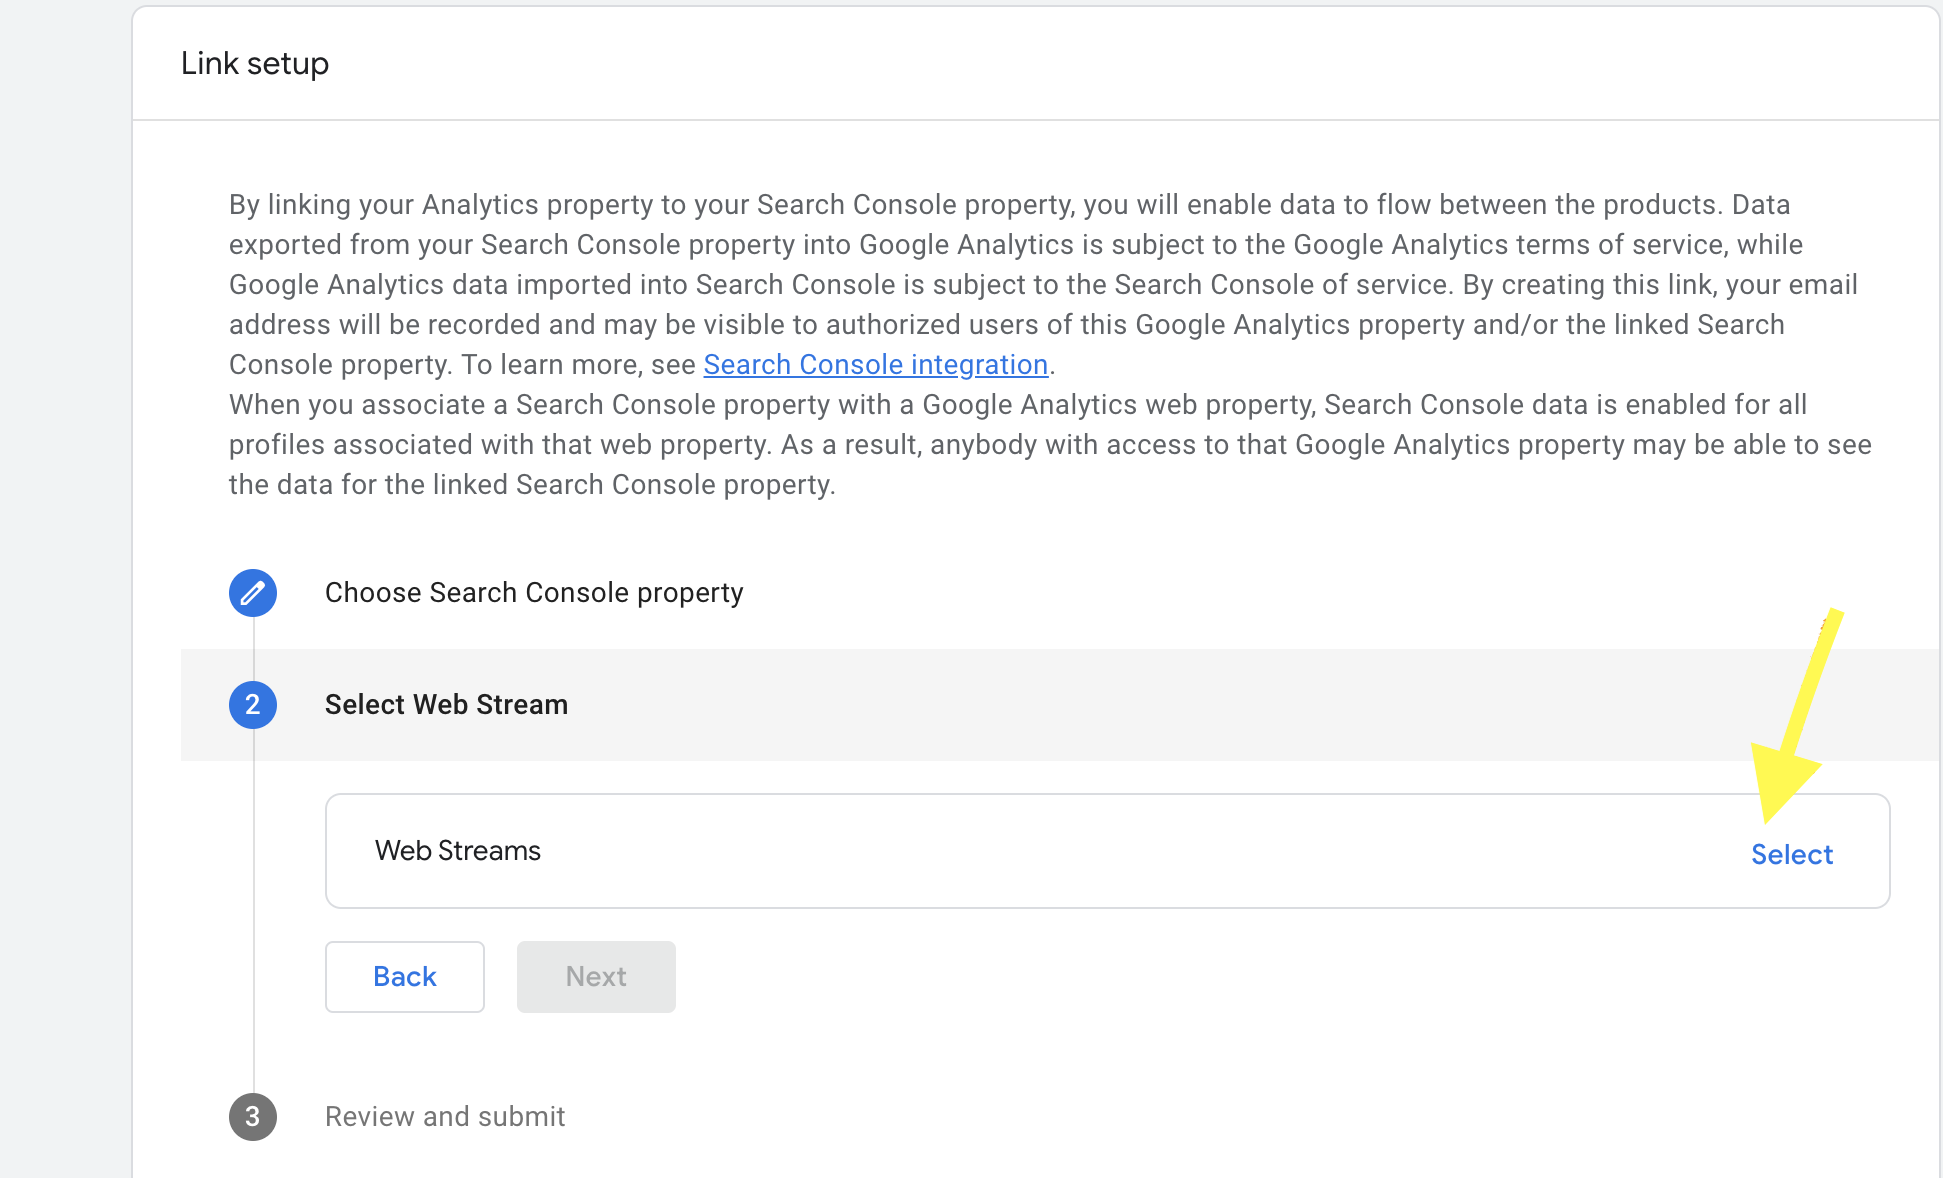
- In the next step, click on web stream and Select
- Then Review and click the submit button
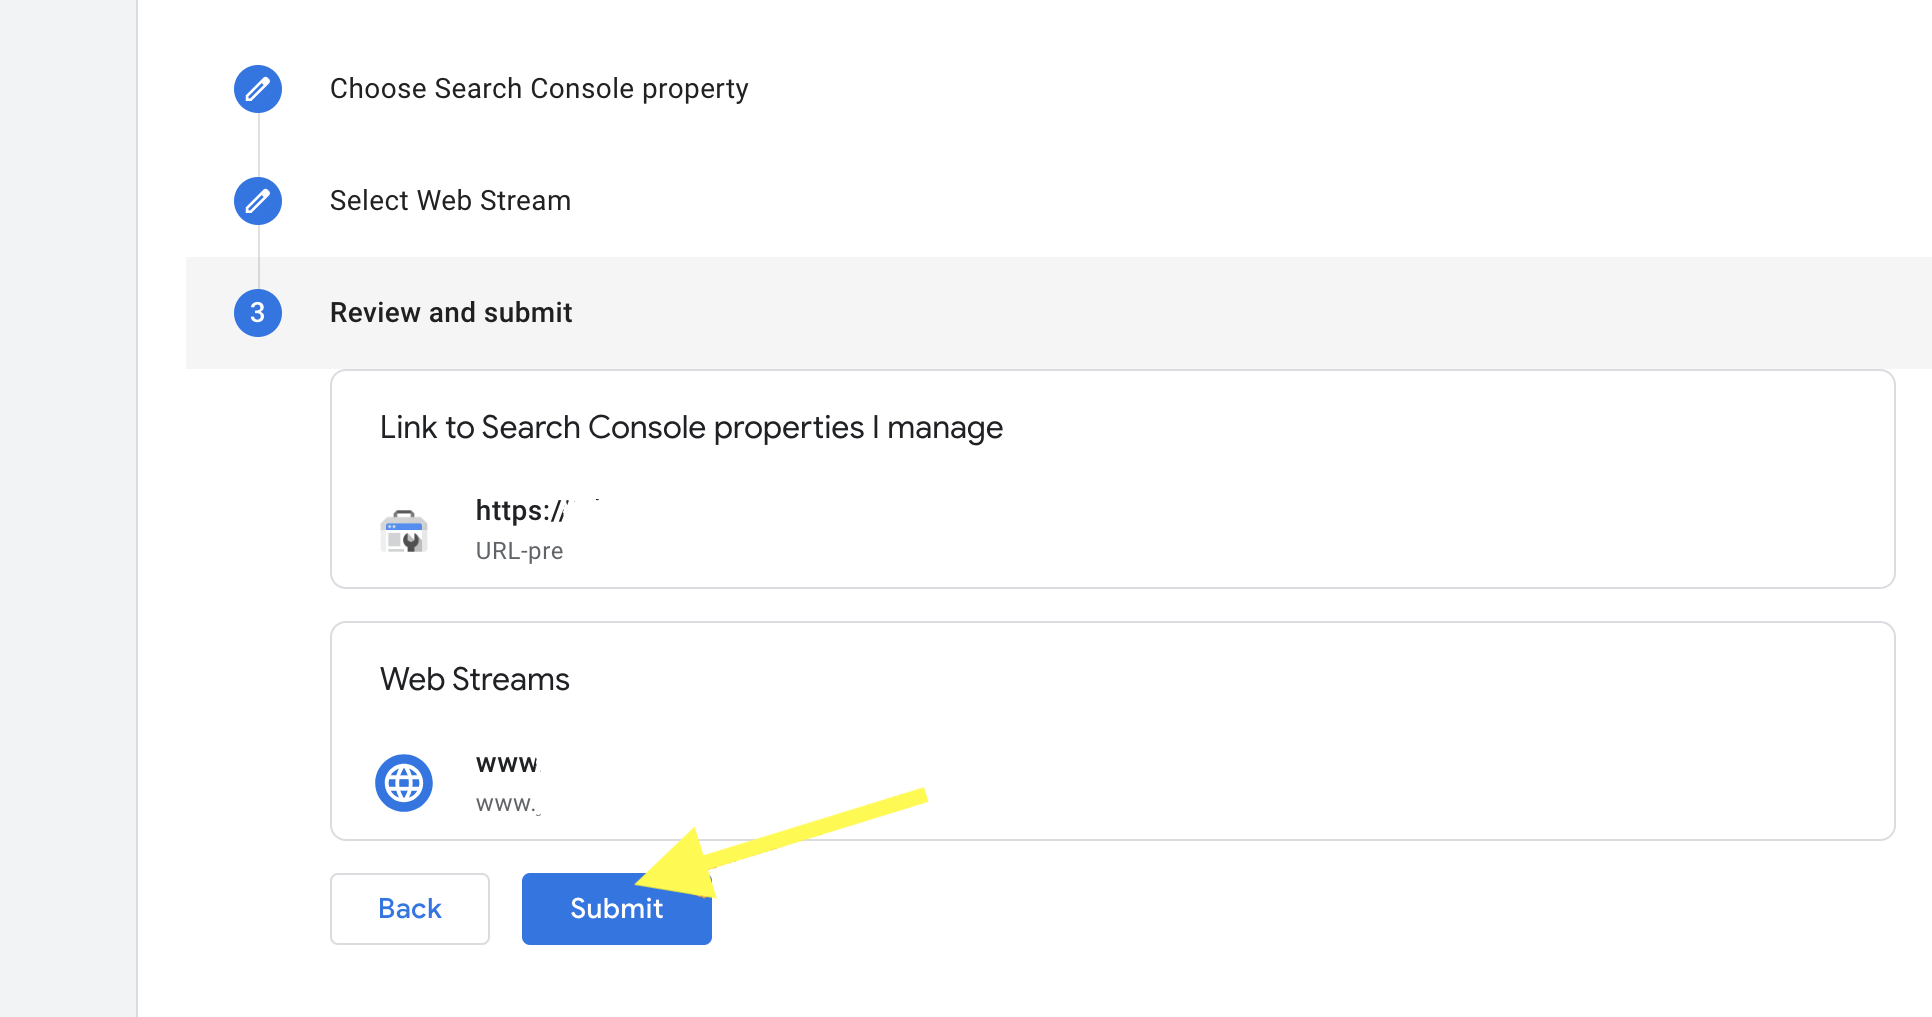
Congratulations! Your analytics and Search console are now linked.
To access the GSC data in Google Analytics 4, take the following steps:
- Log into Google Analytics 4
- Click on ‘Report’ in the left menu section.
- Scroll down and click on the library icon.
- Under Collections, Go to Search Console
- Next to Search Console, click the 3 dots on the right
- Next, click publish
You can now access your GSC data from reports.
Within The Google Search Console Report in Google Analytics 4 there are two main reports:
- Queries: This shows the keywords people used to find your pages from search results.
- Google Organic Search Traffic: This report shows the landing pages on your website that users visited from organic search results.
Expanding any of these dimensions will open more metrics like clicks, impressions, click-through rate, and average position for individual queries or landing pages.

How to Add Your Website Sitemap to Google Search Console
A sitemap is essentially a table of contents for your website.
There are two types of sitemaps: HTML sitemaps, which are typically designed for your website users to easily find pages on your website. Especially for large websites with lots of pages.
XML sitemaps, which are typically designed for search engines. These include the pages, videos, and other files on your website so that they can be more easily discovered for indexing.
How to Find Your Sitemap
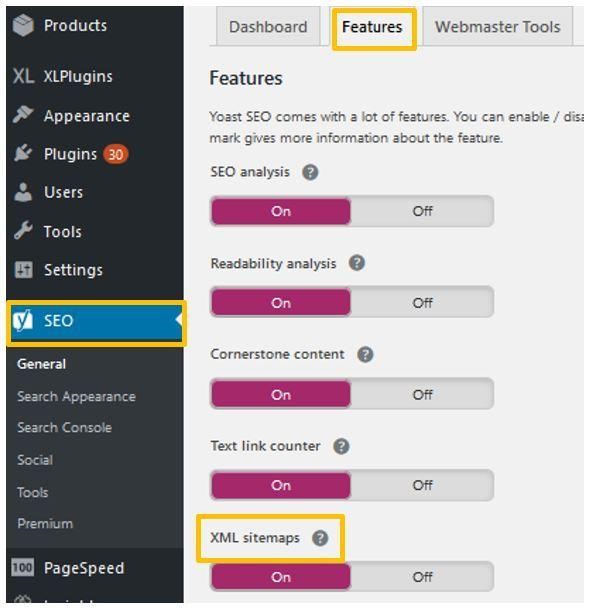
If your site is built in WordPress and you are currently using the “Yoast” plugin, then the sitemap should already be there, you just need to access it.
Follow these steps:
- Log into your website dashboard
- Locate your Yoast Plugin
- Click on ‘General Tab’
- Click on ‘Features’
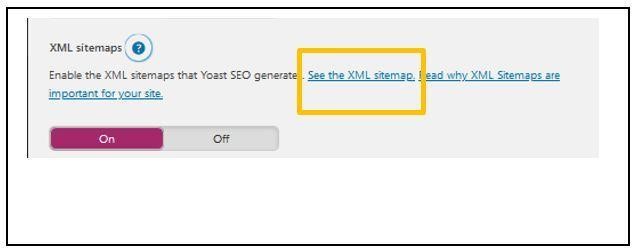
- Scroll down to XML Sitemaps and click the ‘?’ next to XML. Click ‘See the XML Sitemap’
If you don’t use WordPress and use another website platform such as Squarespace or Shopify, they both have built-in XML sitemaps.
Access Shopify XML Sitemap Instructions here.
Access SquareSpace XML Sitemap Instructions here.
For other platforms, I would recommend reaching out to their support directly for guidance on how to locate your sitemap.
If you don’t use “Yoast”, and you’re not sure if you have an XML Sitemap you can go to yoursite.com/sitemap.xml. If you have a sitemap, you’ll find it here. If not, you will need to create one.
To create a sitemap, go to xml-sitemaps.com and follow the steps to generate a sitemap and add it to your website.
Submitting a Sitemap to Google Search Console
- Log into your GSC account
- Click on ‘Sitemap’ in the left side panel
- Typically to the top, you will see your website address, for example, yourwebsiteaddress.com/
- Enter everything after the slash for your sitemap. E.g., if the URL for your sitemap is yourwebsiteaddress.com/sitemap.xml enter sitemap.xml after the slash
- Click ‘Submit’

This concludes the process of setting up your business in Google Search Console.
Your website is now verified by Google, and you can now:
- monitor your website’s SEO, including traffic from Google, rankings, and click-through rate.
- get direct notifications on broken links, website errors, etc.
- improve your SEO with valuable new information.
How To Monitor Your Website SEO Performance Using Google Search Console Cool Features.
Now that you have successfully set up Google Search Console (GSC) on your website, you can access a variety of insights and monitor your website’s overall performance on Google.
To do this, simply click on the Performance tab in the left-hand section. This displays metrics about your website’s performance, including clicks, impressions, click-through rate (CTR), and average position.

- Total clicks: Shows how many times users selected your website page on the search engine result.
- Total Impressions: This is the number of times users saw your website link on Google search results, within a specific period.
- Average Click-Through Rate (CTR): This shows the percentage of people who saw and clicked your website links when they appeared on search engine results.
- Average Position: This is your website page’s position on Google search results.
This is my favorite part of this tool, as you can always confirm if the changes made on a specific page impacted the page’s performance.
In addition to the above core metrics, the performance section also provides a variety of other dimensions including:
- Queries: This shows the keyword that triggered impressions of your website in Google Search.
- Pages: Tells you the performance of individual pages on your website.
- Country: Shows you the performance of your website in different countries.
- Device: Shows the performance of your website on different devices, such as desktop, mobile, and tablet.
- Search Appearance: Shows you how your website appears in Google Search results, including rich results such as featured snippets and knowledge graphs.
- Dates: Allows you to compare your website’s performance over different time periods.
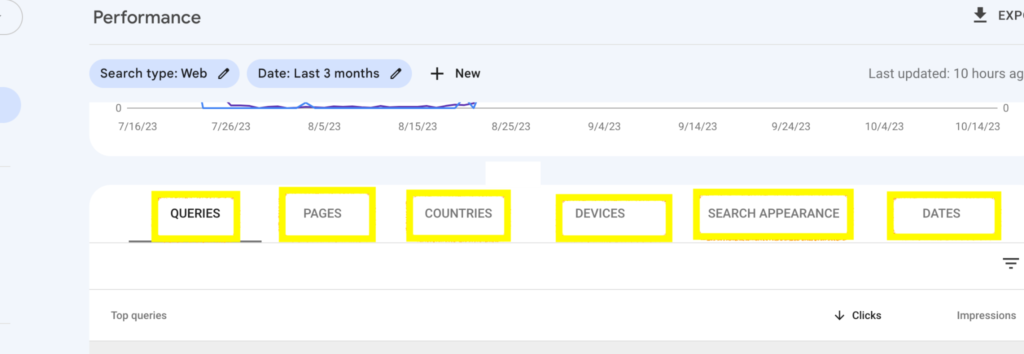
You can use these features to identify areas that need improvement on your website.
To explain how to use these features, I’ll create a simple case study and try to walk you through how to troubleshoot it using these tools.
Using GSC to identify pages that need more attention and improve your website’s conversion rate.
Case study:
A client complains that their traffic has gradually dropped in the last 6 months and seeks suggestions to improve their site’s traffic.
To tackle this issue, we will need to filter out pages that meet certain criteria, such as pages that have experienced a drop in clicks during the selected period and have contributed to this traffic loss. Once these pages have been identified, we can then optimize them to improve their performance.
Steps:
-
-
-
- Click on the Performance tab in GSC.
- Confirm that the Search type is set to the Web.

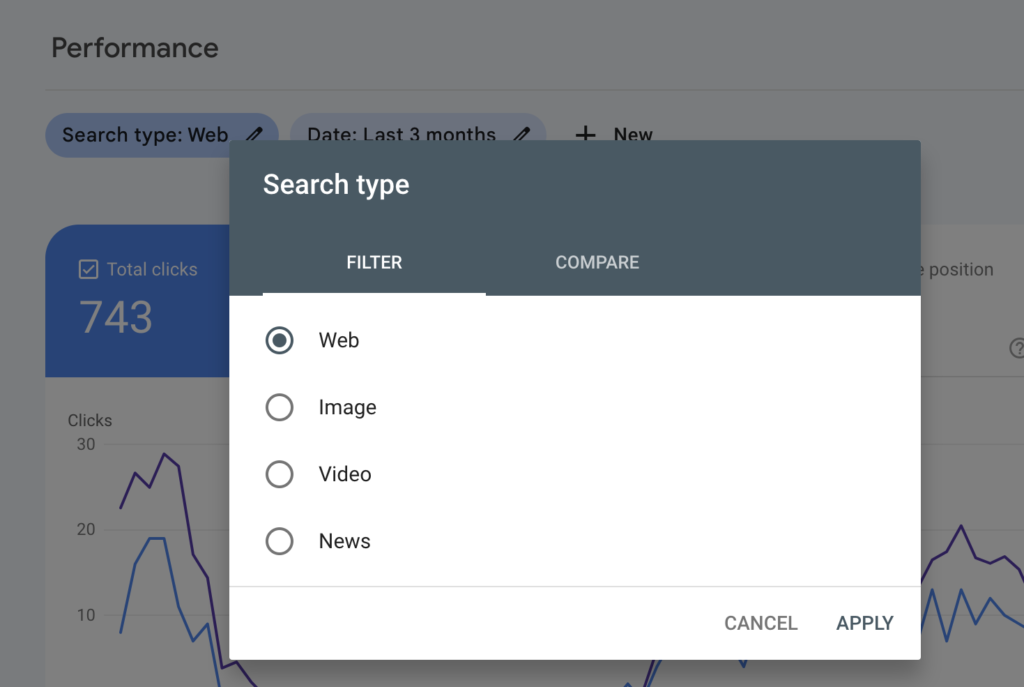
- Click on the Date filter and change to the last 6 months or 12 months to gain a broader perspective on data.

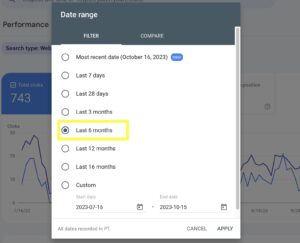
Click on apply.
- Scroll down to the dimensions below and click on Pages.
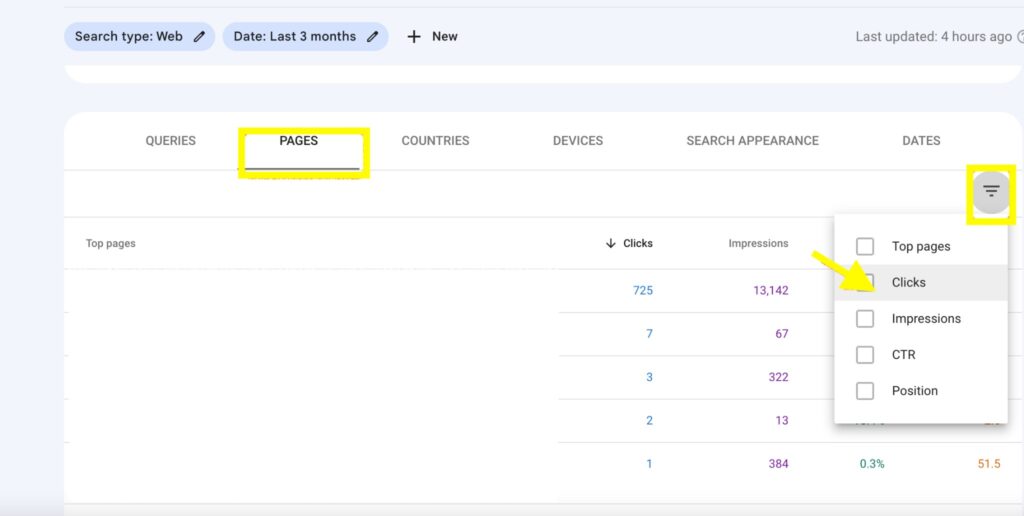
- Click the descending filter button and select Clicks.
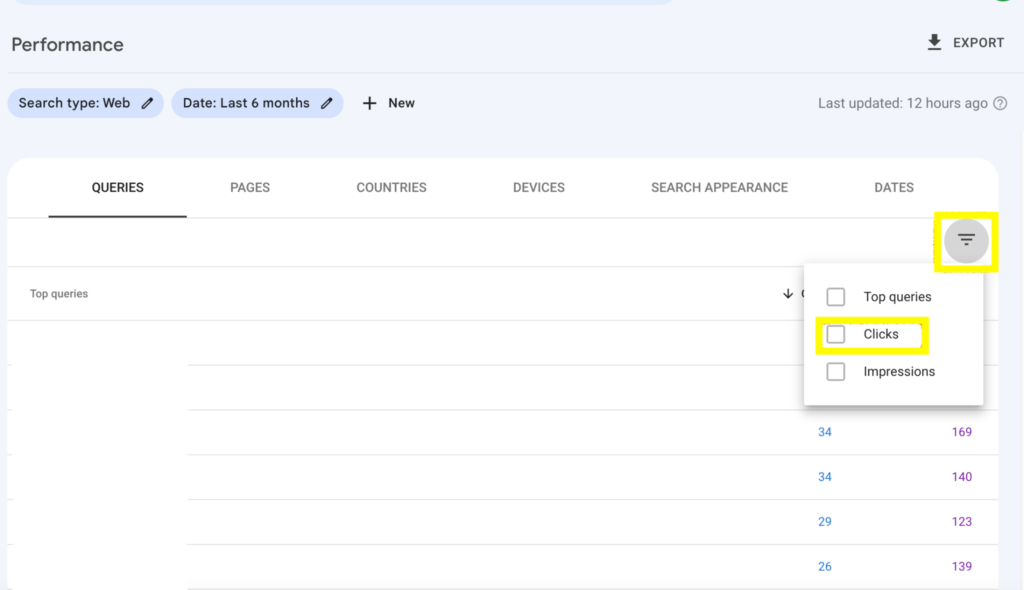
- Click the triangle drop-down by the right to reveal filter options.

- Enter a minimum number of clicks in the “Smaller than” field.
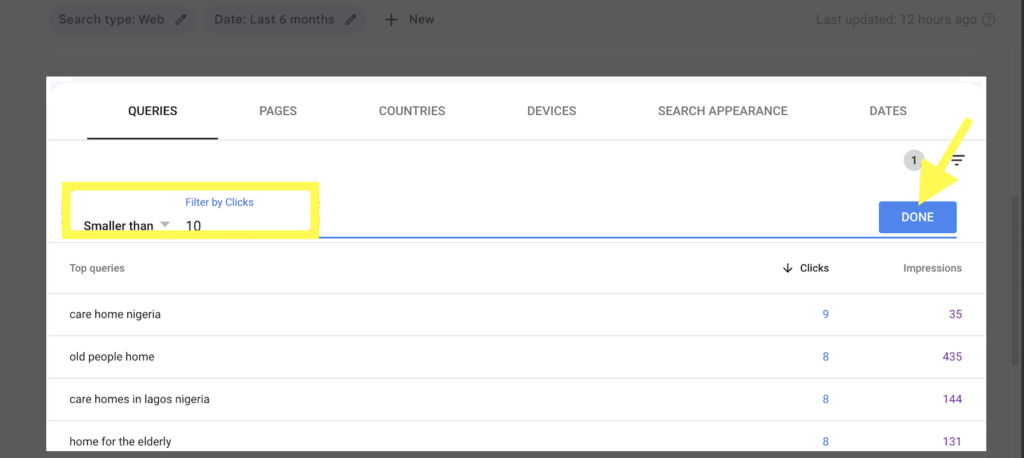
- Click on the Done button.
This will filter the Performance report to show you only the pages on your client’s website that have received a minimum number of clicks in the past 6 months. You can adjust the number of clicks in the filter to see smaller or higher clicks.
You can view the queries that are generating impressions for the individual pages, the countries where the impressions are being served, the devices on which they were displayed, how they’re appearing, and the dates on which the impressions were received, by clicking on the dimension tabs.
Once you have identified pages that need optimization to improve their clicks and attract more traffic, you can start to figure out actions to suggest.
For example, you might improve the titles and descriptions of the pages, create more engaging content, make some on-page changes like implementing Schema markup, or make your pages load more quickly.
Tracking your optimization progress using GSC
You could analyze the progress of the changes you made on your website page to see if they yielded any positive results.
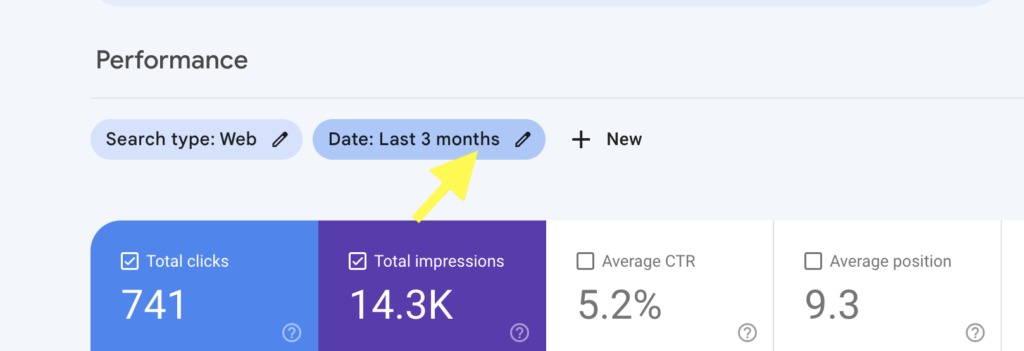
To do this click on the date filter button.
Select the compare button and choose the date range you will want to compare. You can also choose a custom date.
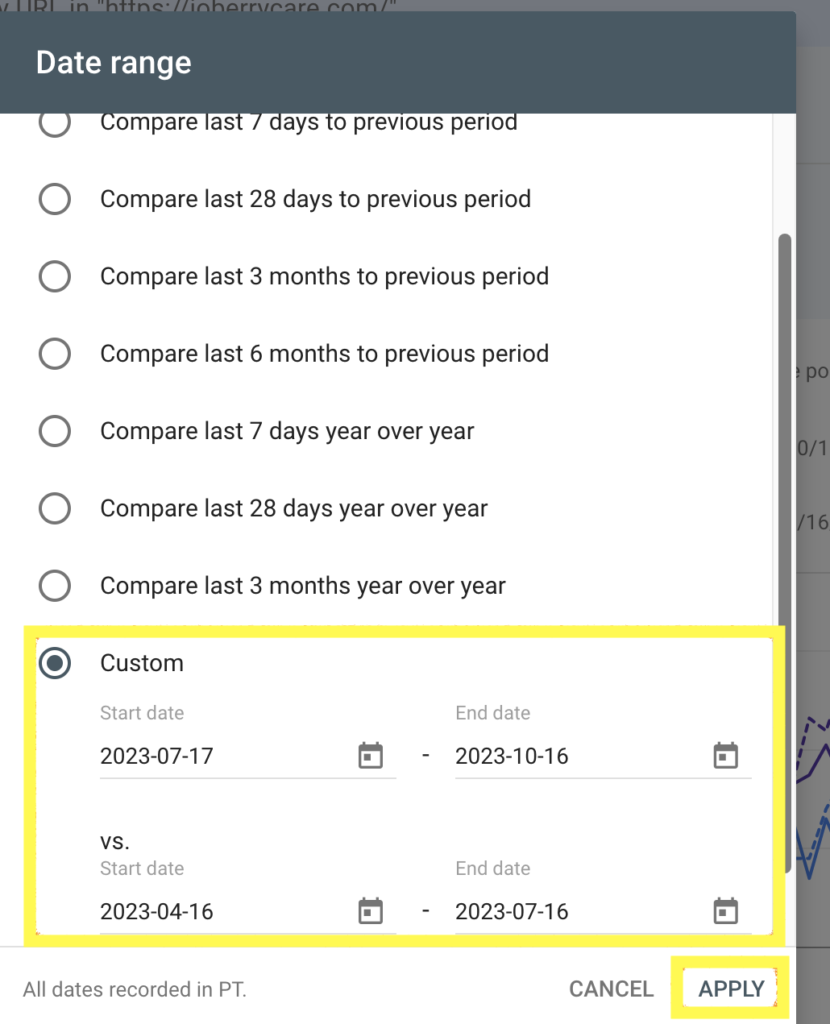
Here I compare 3 months after changes were made to 3 months before changes were made.
You can play around with the Performance feature in GSC to obtain various needed insights with the +New button and filter out data as needed.

How to use the Page Indexing report in GSC to troubleshoot indexing errors.
Google search console offers you insight to understand the technical status of your web pages and troubleshoot errors using the Page indexing feature.
The Page Indexing tool gives an overview of the indexing status of your website’s pages.
It shows you which pages have been indexed by Google and which pages have not. It also shows you the reasons why some pages are not indexed.
To view the Page Indexing report, go to the Indexing section and click on Pages.
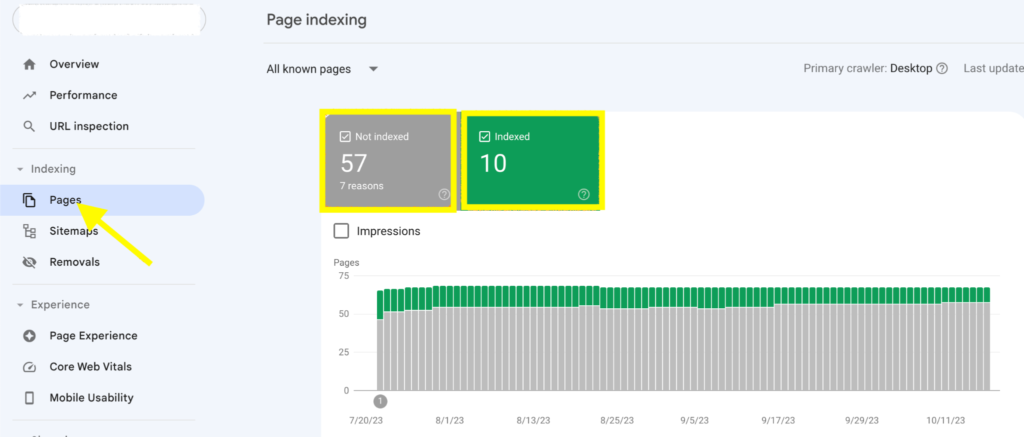
This displays two metrics section:
- Indexed pages: Shows the pages on your website that have been indexed by Google.
- Not indexed pages: This shows a list of all pages on your website that have not been indexed by Google.
For each page in the “Not indexed” pages section, you will see a reason why the page is not indexed. Some common reasons include:
- Meta robots tags: The page has a meta robots tag that tells Google not to index the page.
- Server errors: Google encountered a server error when trying to crawl the page.
- Redirect: The page redirects to another page, and Google has decided not to follow the redirect.
- Canonical issues: The page has a canonical tag that points to another page, and Google has decided to index the canonical page instead.
- Crawled-currently not indexed: Google found and crawled the URLs but has chosen not to add them to their index for various reasons.
- Discovered- currently not indexed: Google is aware that the page exists but hasn’t crawled or indexed it.
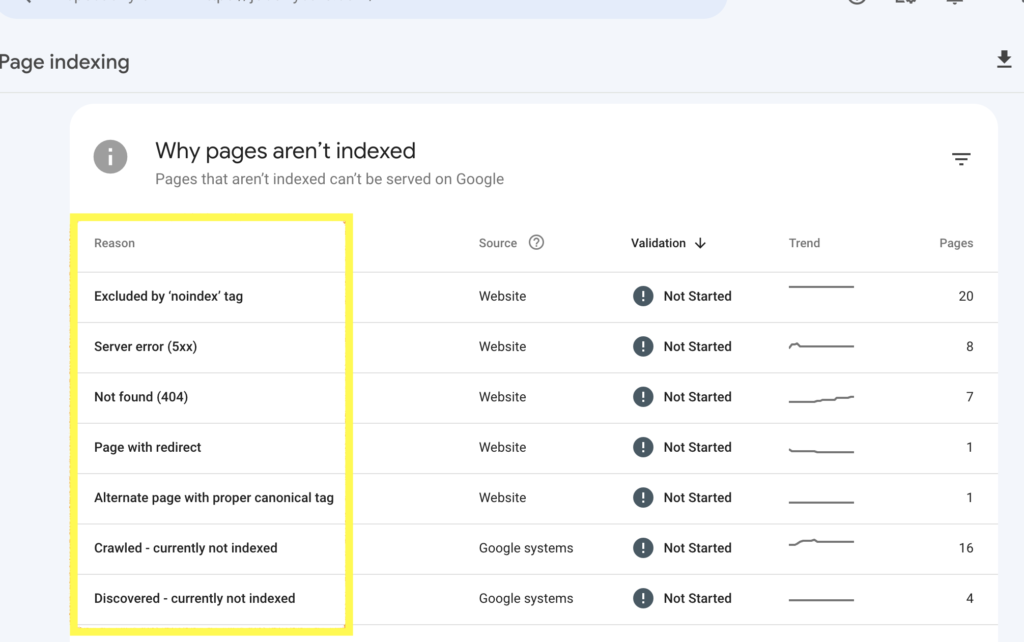
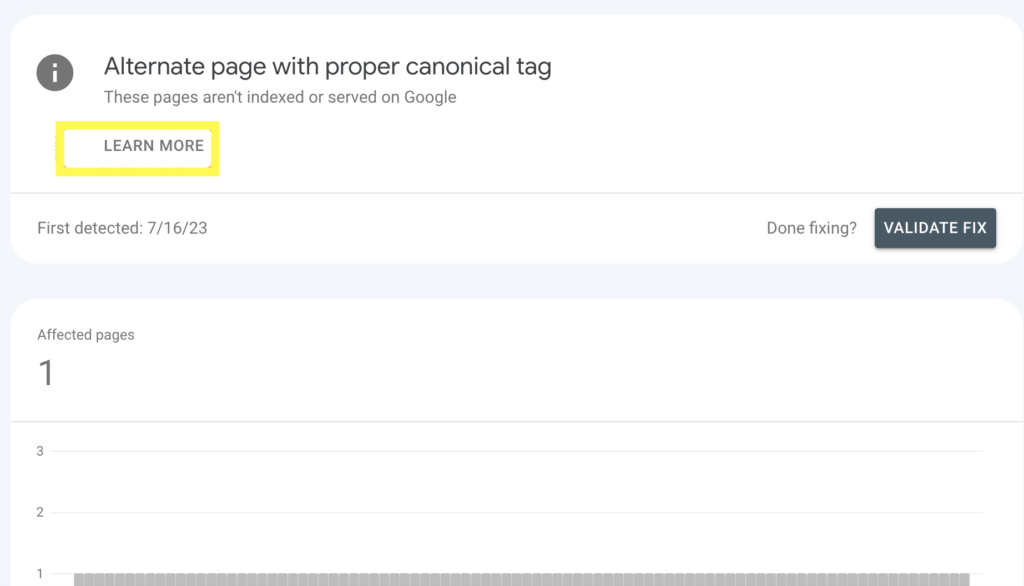
To troubleshoot an indexing error, click on the reason for the error. This will open a page with URLs affected by this error and a learn more option that takes you to a document with details on how to fix the error.
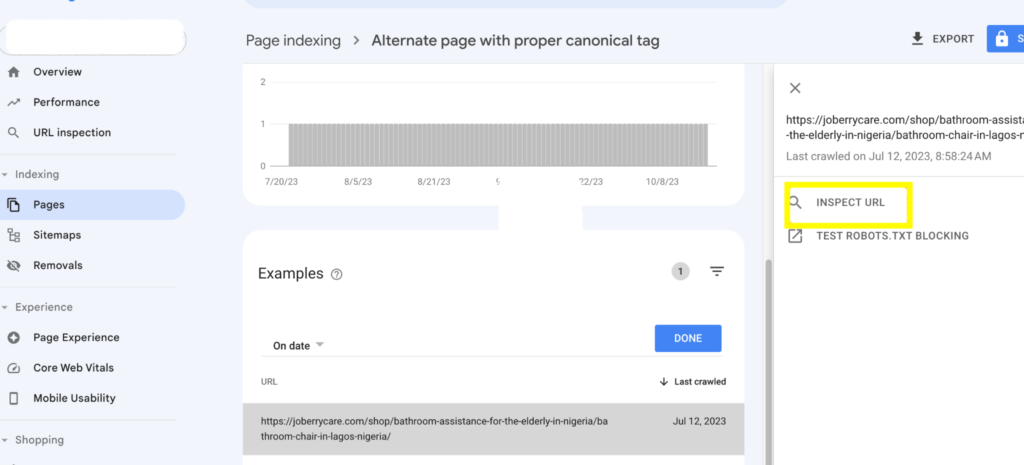
To delve deeper, click on the affected URL. This will open additional options, such as testing whether the URL has been blocked in the robots.txt file or using the URL Inspection tool.
Clicking on the URL Inspection tool will provide you with detailed information about the page indexing status and any errors that Google encountered while crawling or indexing the page.
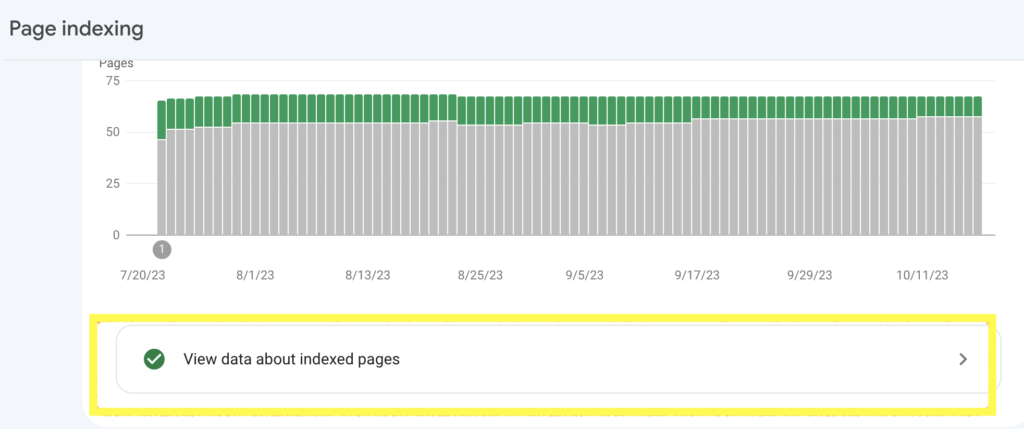
You can also use the Page Indexing report to track the impact of changes you made on your website. For example, if you fix a technical issue that was preventing a page from being indexed, you could check the Page Indexing report to see if Google indexed the page.
You should expand the “View data about indexed pages” tab, and check if the number of indexed pages has improved and if the specific page you worked on got indexed.
Identifying Technical Problems with The URL Inspection Tool.
The URL Inspection tool provides you with detailed information about how Google crawls and renders your pages.
To use this tool, go to URL inspection and enter the URL of the page that you want to inspect in the search bar.

You can also access the inspection tool by simply selecting the Inspect URL option when analyzing Indexation issues, as we previously did.
The URL Inspection tool will show you the following information:
- Page indexing status: This shows you whether the page is indexed by Google.
- How discovered: This tells you how Google found the page.
- Crawl details: This includes the time that the page was last crawled and the type of bot that crawled it.
- Page fetch: This shows whether Google was able to successfully retrieve the page and the reason for any failures.
- Google-selected Canonical: This shows you the canonical URL that Google has chosen for the page.
- User-declared canonical: This shows the URL the site owner has selected as canonical for the page.
- Page experience: This shows you information about the page’s mobile usability and page enhancements.
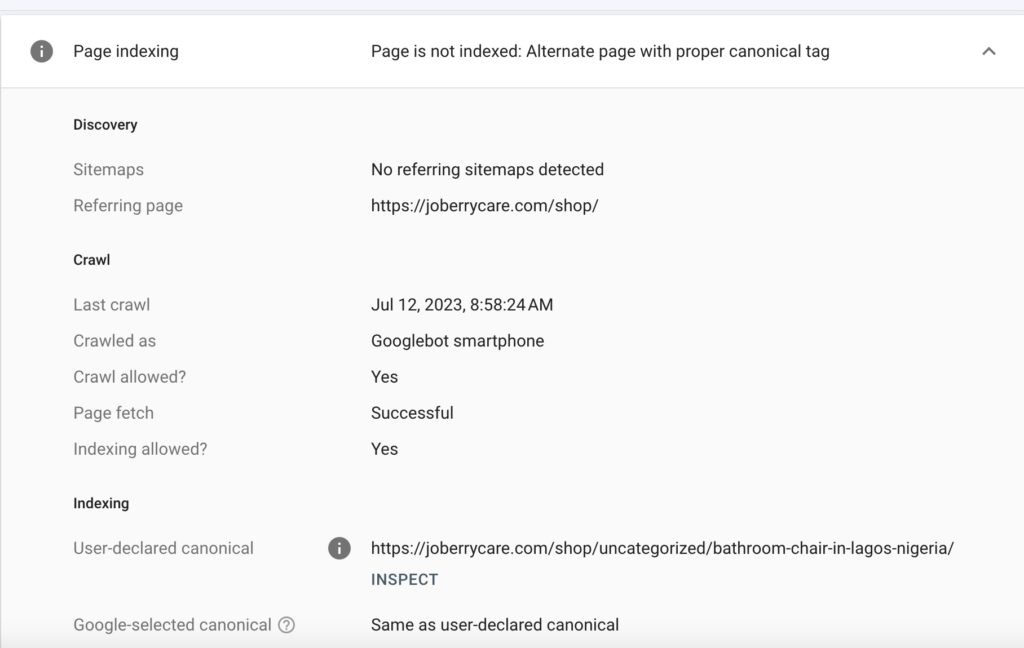
To identify technical problems, you can review the information provided by the URL Inspection tool.
For example, if the page is not indexed by Google, you can check the “How discovered” section to see if Google is able to discover the page.
You can also check the Crawl details section to see the last time the page crawled and if there are any errors that are preventing Google from crawling the page.
If the page is indexed by Google, you can review the Enhancement and Experience section to see if there are any mobile usability or page enhancement errors.
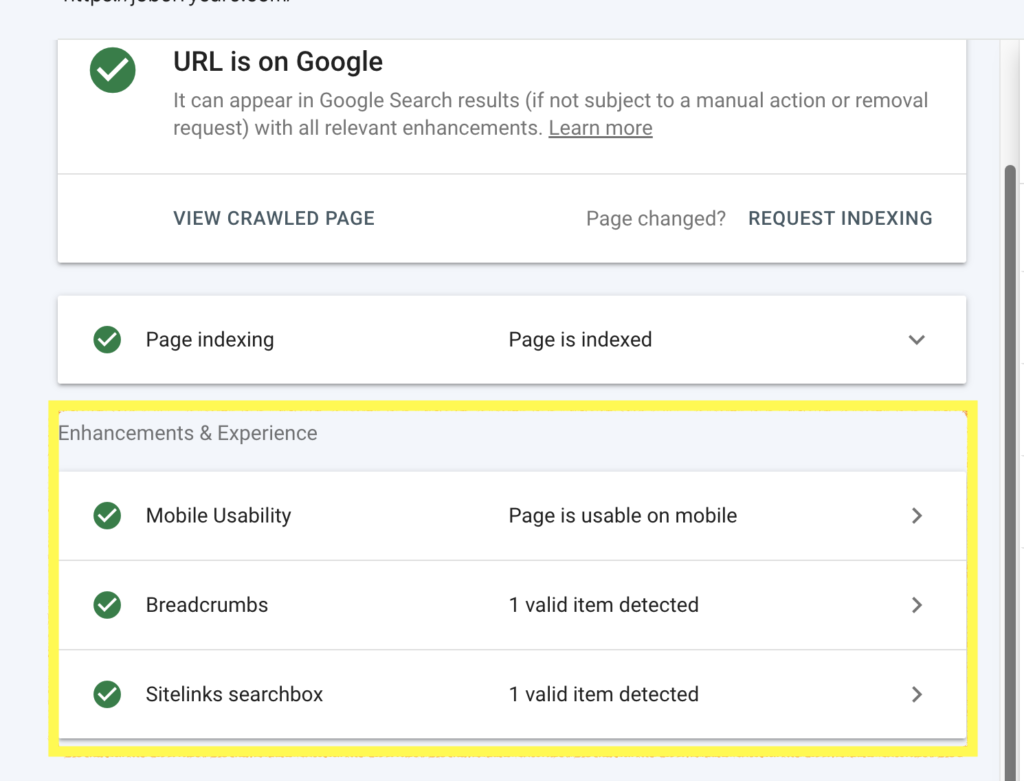
Once you’ve been able to figure out and fix the error, resubmit the URL to Google by clicking the VALIDATE FIX button.

If the page is indexed, you can see a preview of the page as it appears on Google Search, to do this
- click on the Test Live URL

- Click on View Tested Page

To see how Google is rendering your page,
- Go to the Tested page section on the right and
- click the Screenshot button. This will show you a screenshot of the page as it appears on Google.
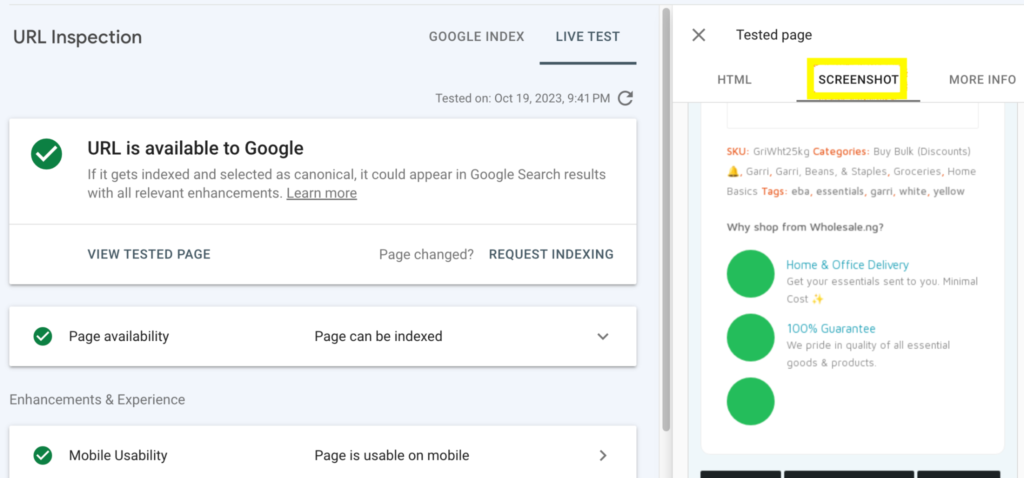
If the content you see here looks different from the original content on your site, then you should take steps to ensure that Google renders the page correctly. For example, if the images on your site are missing from the screenshot tab, troubleshoot further to identify the root cause of the page rendering issue.
To gain more insight into the technical status of the page you are inspecting, click on the More Info tab.
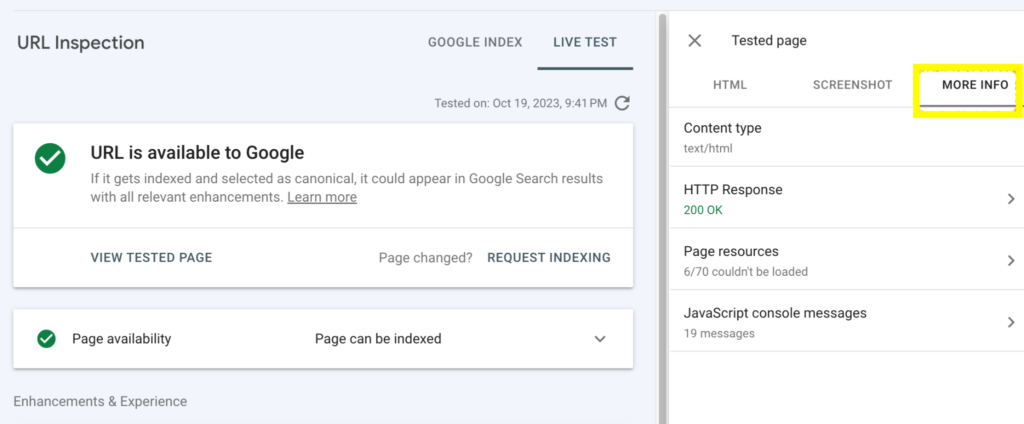
This will reveal more details such as the HTTP response code of the page and also a list of the resources that Google wasn’t able to load, this may include images, CSS files, JavaScript files, or other types of files.
You can use this information to troubleshoot problems on the page and improve the page’s performance. For example, If you see that Google is unable to load certain resources on the page, you can check to make sure that the resources are not blocked by robots.txt or other access controls.
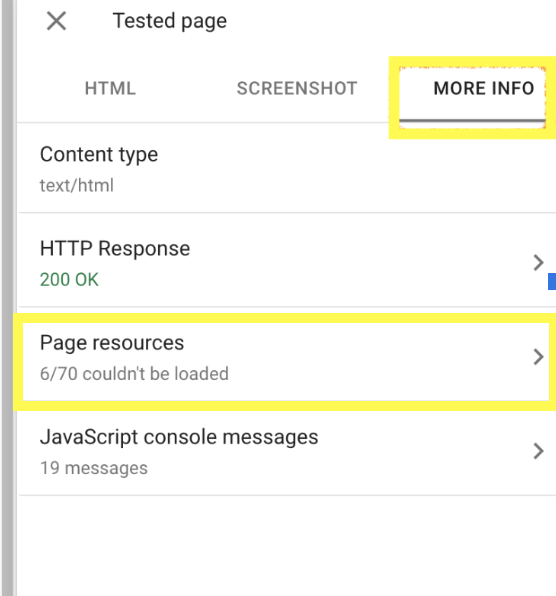
As shown in the screenshot above, 6 out of 70 resources were not loaded by Google, because they were intentionally blocked for security and privacy reasons.
It is okay to block certain resources, such as login pages, ads, and third-party tracking scripts, from being crawled and indexed by Google. You should only be concerned if you’re blocking essential resources that could impact your site performance.
Google Search Console Page Experience Report: Insights into User’s Experience
The Google Page Experience Report provides a snapshot of how users experience your website and how it performs against Google’s Page Experience criteria, which are a set of signals that measure the quality of a user’s experience on a web page. Google rewards websites with good page experience with higher rankings in search results.
The Page Experience Report is divided into three sections:
- Page Experience Overview: This section provides details of your website’s page experience. It includes metrics such as the percentage of your pages that are Good, the impressions they got, broken into on mobile and desktop, as well as signals they fall short.
- Core Web Vitals: This section provides insights into your website’s performance on the Core Web Vitals metrics. Core Web Vitals are a set of metrics that measure the loading speed, interactivity, and visual stability of your pages.
- Mobile Usability: This section provides insights into your website’s performance on mobile devices. It includes metrics such as whether your pages are mobile-friendly and whether they have any mobile usability issues.
To view the Page Experience Report:
- Go to the Google Search Console Experience section.
- Click Page Experience.
This will open the Page Experience Overview section which provides a summary of your website experience on mobile and desktop.
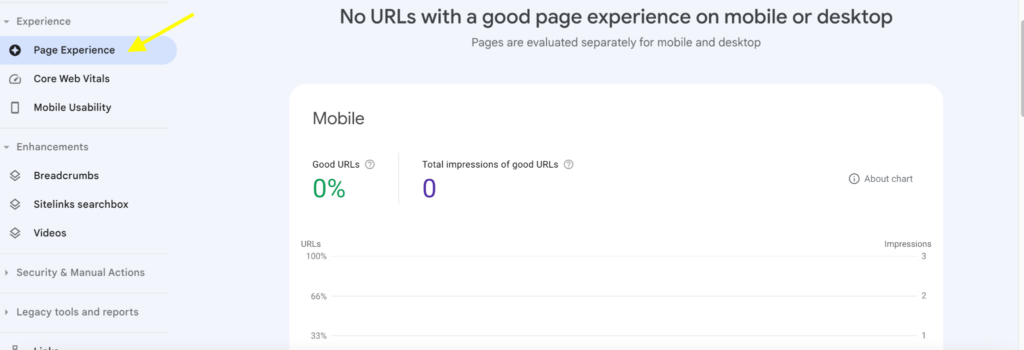
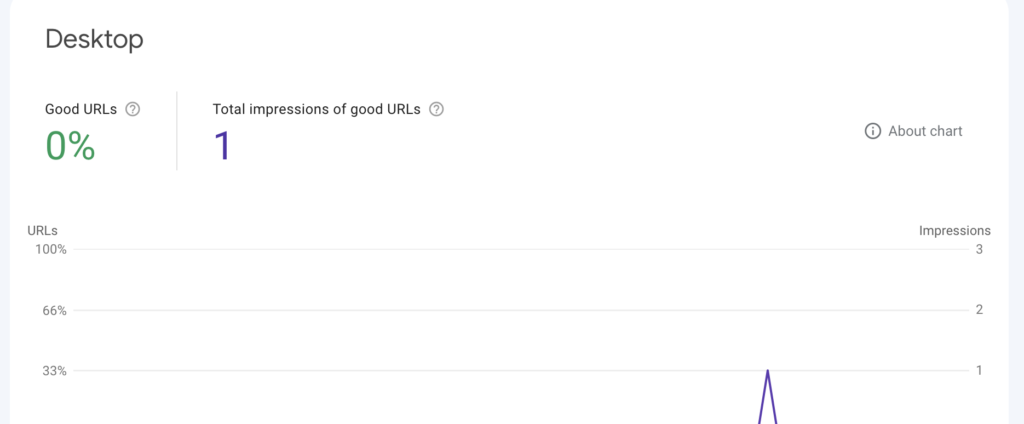
Percentage of good URLs: shows the percentage of your pages that meet Google’s criteria for a good page experience and the total number of impressions they got.
Page experience signals: This section shows which page experience signals your site is meeting and which ones they are falling short on. It also shows the number of URLs that contributed to each signal.
The page experience signals section includes the following metrics:
- Core Web Vitals
- Mobile usability
- HTTPS
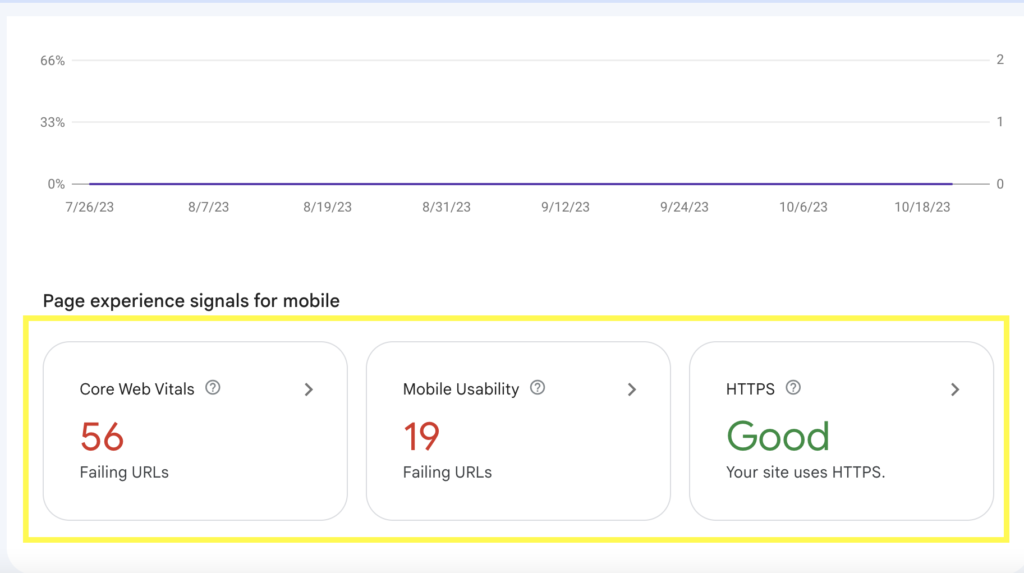
Clicking on each metric will open a report that shows the reasons for the failing URLs and the individual URLs in each category. For example, this website has 56 URLs that failed the Core Web Vitals test. To determine the cause of this failure, we can click on the Core Web Vital metrics tab.
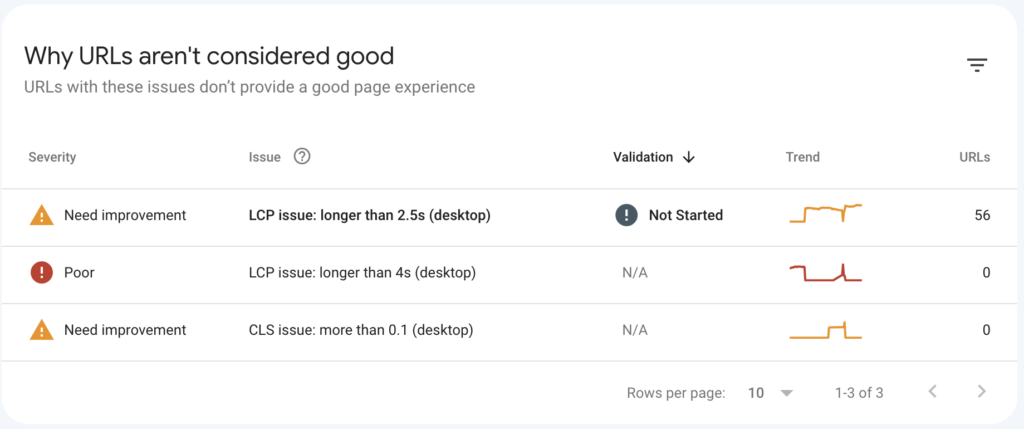
This reveals that 56 pages take 2.5 seconds to render (load) the largest visible image on the page. We can then click to see the exact URLs that failed the Largest Contentful Paint (LCP) metric and try to optimize those pages.
Mobile Usability
Similar to the Core Web Vitals, the Mobile Usability metric tab in Google Search Console shows you the pages on your website that are not mobile-friendly, as well as the specific reasons why Google has detected this issue. You can click on each reason to see a list of the affected URLs, and then inspect those pages to identify and fix the problems.
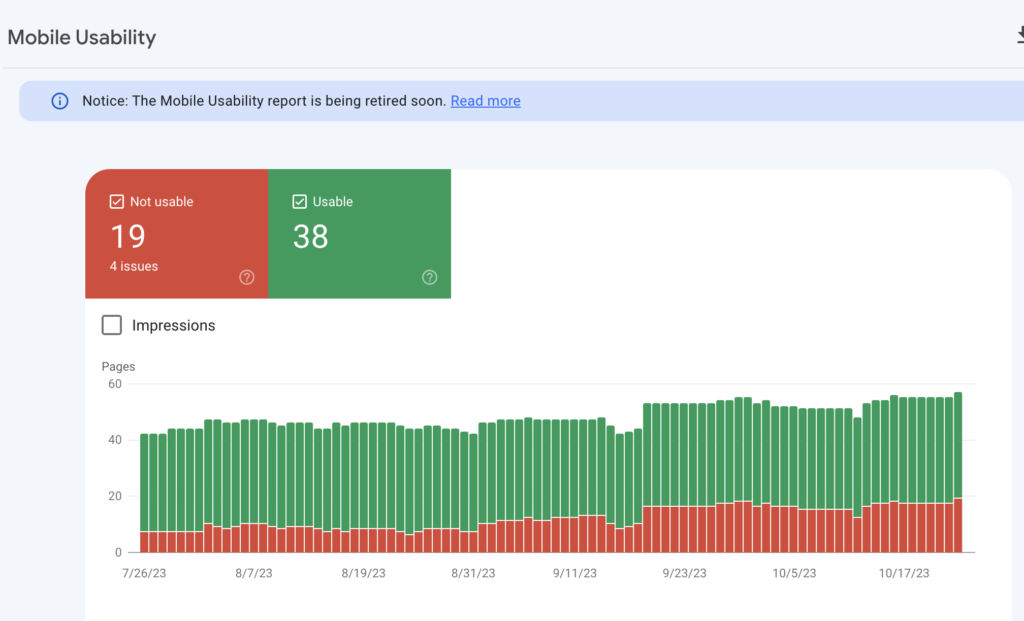
Here are some examples of common mobile usability issues:
- Text is too small or too close together: This can make it difficult for users to read your content.
- Clickable elements are too close together: This can make it difficult for users to click the links in your text if they are too close together.
- Content is not visible without scrolling: This can make it difficult for users to find the information they are looking for as they need to scroll horizontally to view all of the content on the page.
- Viewport not set: The viewport tells the browser how to scale the page to fit the screen of the device on which it is being viewed, when not set properly it can cause the page to be displayed incorrectly on mobile devices.
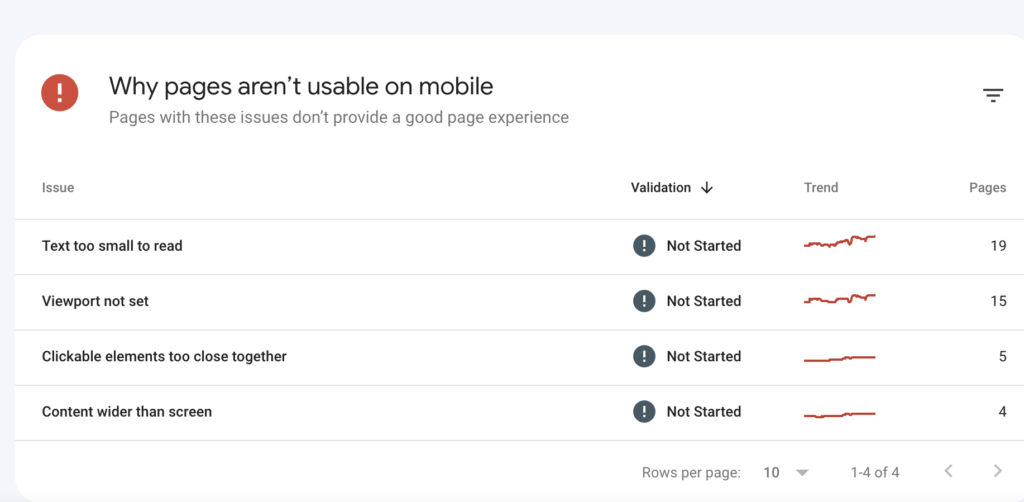
You can click on the reasons to review the URLs that fall into the category, then inspect them further to see how to optimize them.
Improve Your Website’s Visibility in Search Results With GSC Enhancement Section
The Enhancement Report Section in Google Search Console helps you identify and fix errors in your website’s structured data markup.
What does structured data have to do with the enhancement report section?
Structured data is a way to provide Google with additional information about your website’s content, such as product information, event details, and reviews. This information can be used to improve the appearance of your website in search results and display rich snippets, such as site links, star ratings, and product prices, and increase your site Click Through Rate.
The enhancement report section includes a section for structured data, which shows you how well your website is implementing structured data and any errors or warnings that Google may have encountered.
How to use the enhancement report section
To use the enhancement report section:
- Go to the Enhancements section in Google Search Console.
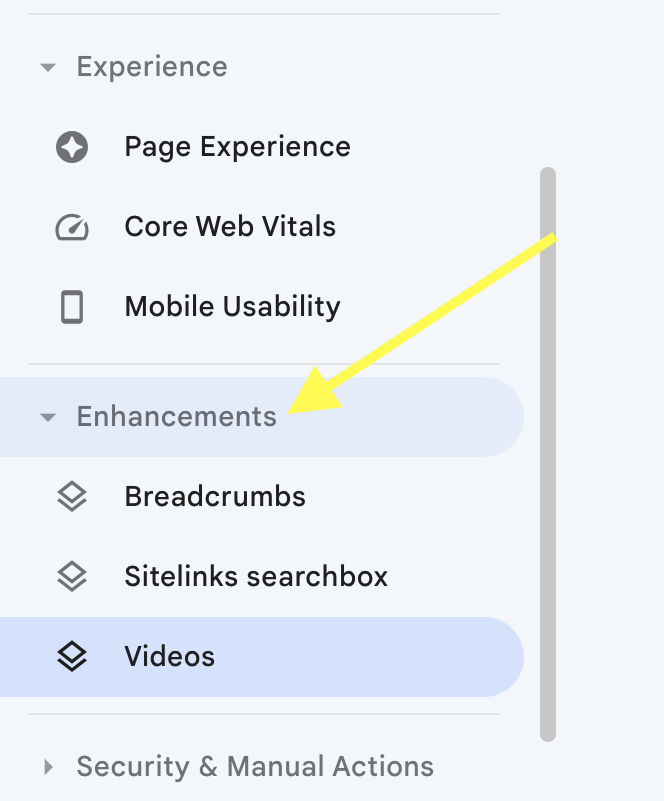
You will see a list of all the different categories of enhancements that Google supports on your site.
If you click on each category, you will see the number of pages on your website that have the enhancement, as well as the number of pages that have errors or warnings related to it.
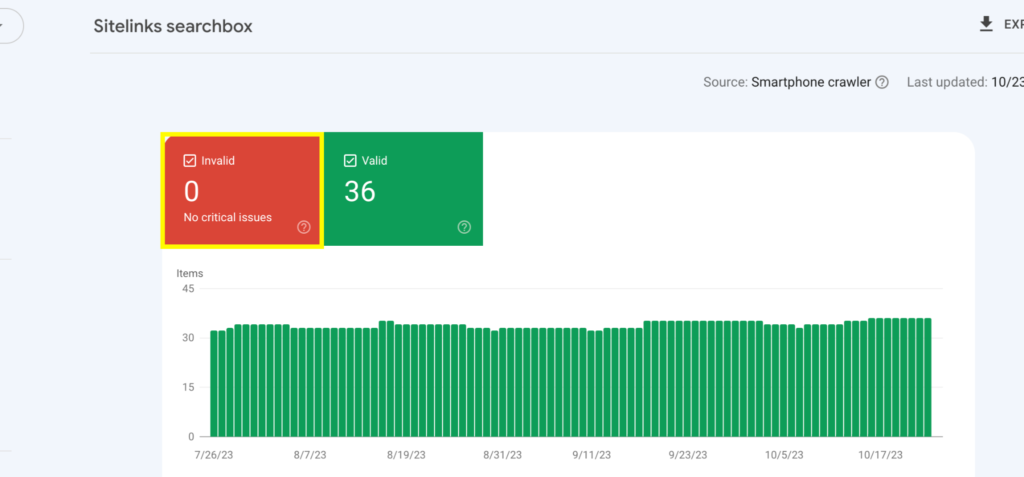
The Invalid tab for this site shows 0, indicating that there are no pages with invalid structured data.
If your website shows otherwise you can click on each category to see a list of the specific pages with errors that hinder the performance, as well as instructions on how to fix it.
Find Pages That Need Internal Linking Boost with Google Search Console
The Links report is another awesome tool that Google Search Console features. You can use this tool to understand and improve your website’s link profile.
The report shows you a list of the external links that point to your website, the anchor text used in those links, and the pages on your site with the highest or lowest number of internal links.
To view the Links report,
- Go to the Search Console and click on the Links
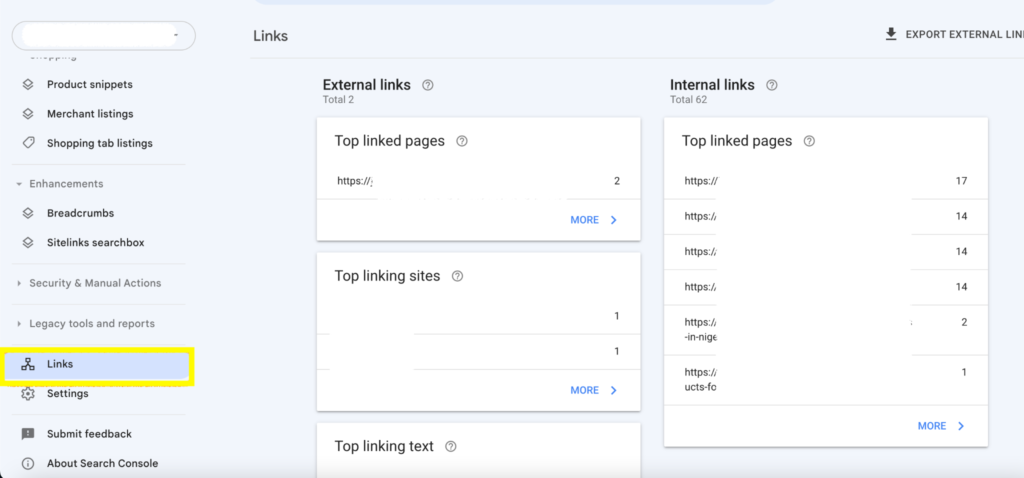
This opens the 2 sections of the Links report:
- External links: This section shows you the total number of websites that have cited your site, the pages that got the most backlinks, the website that linked to you the most, and the text you got linked with.
- Internal links: This section shows you the total number of links within your website and the top linked pages.
To view pages with the least number of internal links,
- click on the more button at the Internal links section to reveal more linked pages.
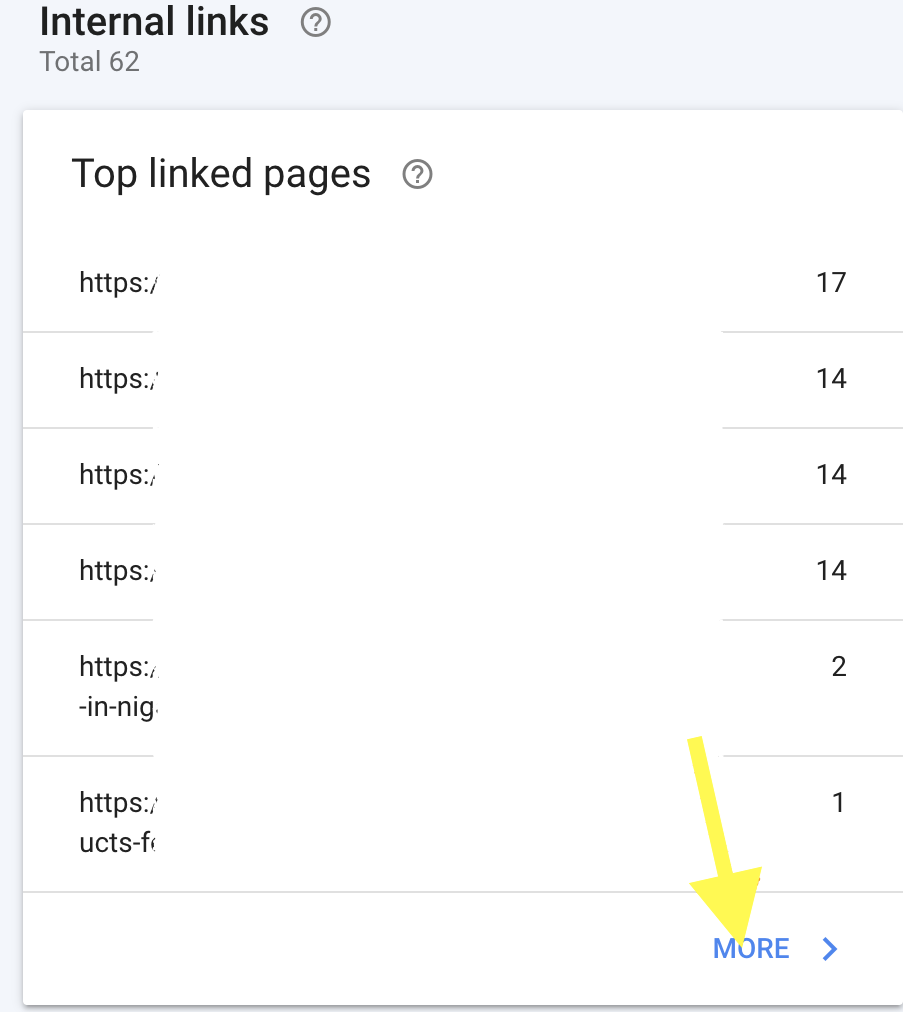
And sort out pages with the least amount of links pointing to it.
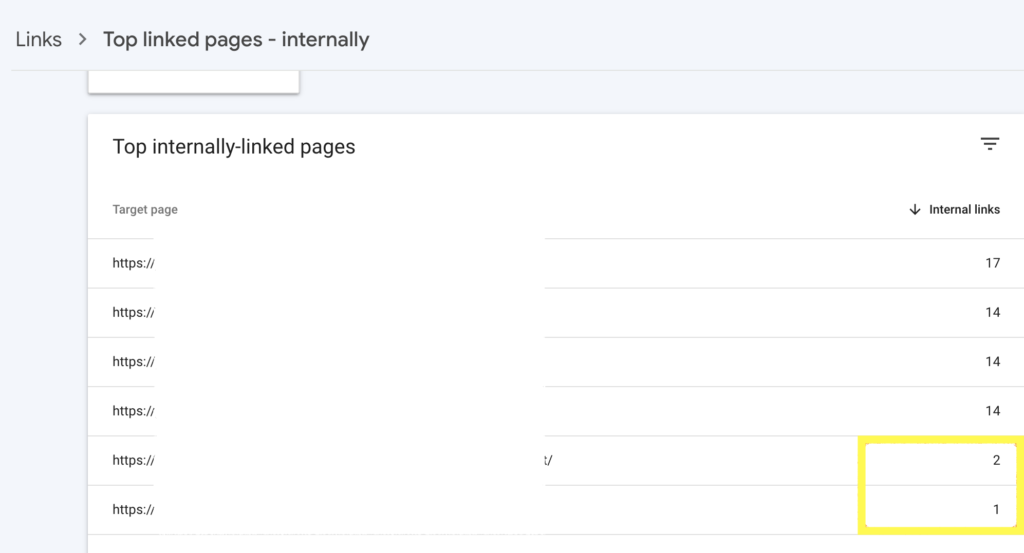
To see the specific pages pointing to each URL click on the individual page.
You can use the Links report to also:
- Identify your most important backlinks. Which are backlinks from websites with high authority and relevance to your own website, you can then reach out to the website owner for more link-building opportunities knowing they find your content relevant.
- Identify backlinks that are using spammy or irrelevant anchor text: This can be found in the “top linking text” section of the report. Links with descriptive text are more valuable than generic or spammy text, you can use this report section to identify sites that are using spammy or irrelevant text to link to your website and remove them when necessary.
- Track the growth of your backlink profile over time: If you are actively building backlinks to your website, you can compare the total number of external links on this report before you start building backlinks to the number of links you have after implementing your strategy. This will help you confirm whether your strategy is working.
Understanding Crawl Stats with Google Search Console
Understanding how and where Googlebot spends the most of its time on your website is very useful in managing crawl budgets, especially for big websites.
Crawl Budget is the number of URLs Googlebot can and wants to crawl on your site.
The Crawl Stats report in Google Search Console provides information on Googlebot’s experience on your website.
This information can be used to manage your crawl budget and ensure that Googlebot is spending most of its resources on important pages of your website and that valuable content gets indexed fast.
To access the Crawl Stats report,
Go to the Settings section in GSC and click on Crawl Stats Open Report.

This opens up a report that shows Googlebot behavior on your site.
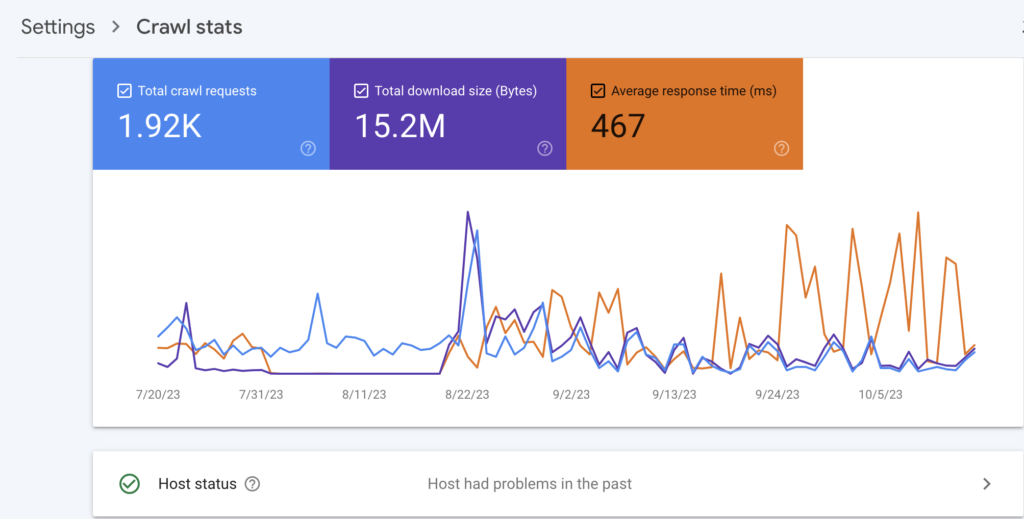
You will see three metrics:
- Total Crawl Requests: This section shows you the number of crawl requests that Googlebot made to your website within the last 90 days.
- Total download size: This section shows you how much (or size of) content Google downloaded from your site within the last 90 days
- Average response time: This shows you how long it took Google to request and retrieve content from your site. A lower number (Response time) shows Google spent less time on your site, meaning crawling was fast.
The recommended average response time for a healthy website is typically between 100 and 200 milliseconds, a response time above 500 ms shows Google is having a difficult time crawling your site. However, there are several factors that can affect the response time of your website, such as the following factors:
- The size and complexity of your pages
- The number of resources on your pages (e.g., images, CSS files, JavaScript files)
- The speed of your web server
- The location of your web server relative to Google’s servers
- The performance of your website’s hosting provider
to improve the response time of your website, try to:
- Optimize your images
- Minify and compress your CSS and JavaScript files
- Use a content delivery network (CDN) to serve your static files
- Upgrade your web server hardware
- Speak to a professional
Analyze Your Host Status with the GSC Crawl Stats Feature
The Host Status section can be seen right under the crawl stats charts,

You can access insights of possible difficulty Google encountered while requesting for your :
- txt file: This is a text file that tells web crawlers which pages and files on your website they are allowed or not allowed to crawl and index.
- DNS resolutions: This is the process used in converting your domain name (e.g., example.com) into an IP address (e.g., 194.188.1.1). This is necessary because web servers use IP addresses to communicate with each other.
and Server connectivity during the ability of Google to connect to your web server and download the pages it wants to crawl. If Google is unable to connect to your web server, it will not be able to crawl your website.
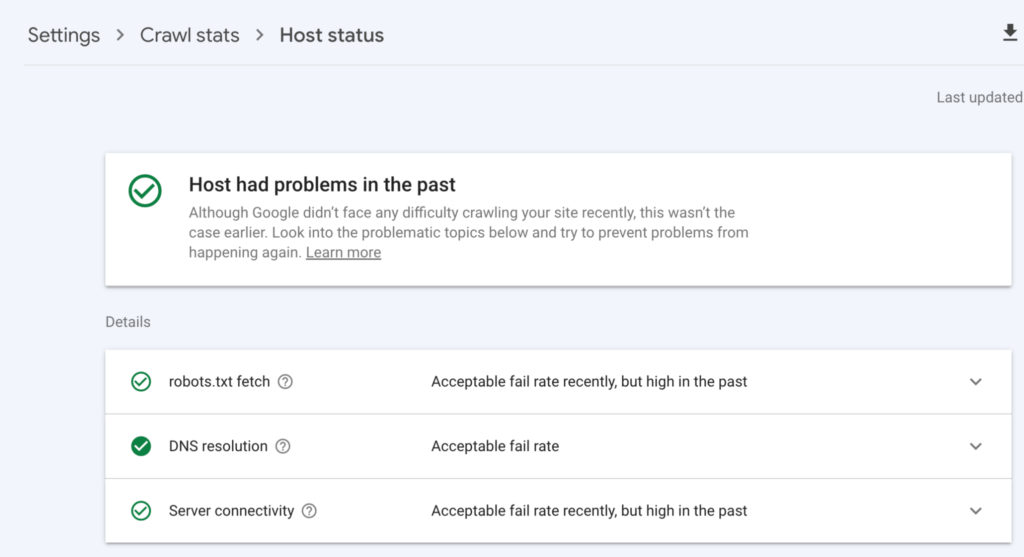
- The green check button (No action is required): it shows Google had no problem while crawling your host.
- The white check button (Identify the issue): shows there has been a crawling issue in the last 90 days.
- Red check (Fix the crawling issue): shows there’s a recent issue you should investigate.
You can click on the host details to gain more insights, such as when Google had issues trying to fetch them.
The Crawl Stat report also gives you access to the crawl request breakdown.
Crawl request breakdown
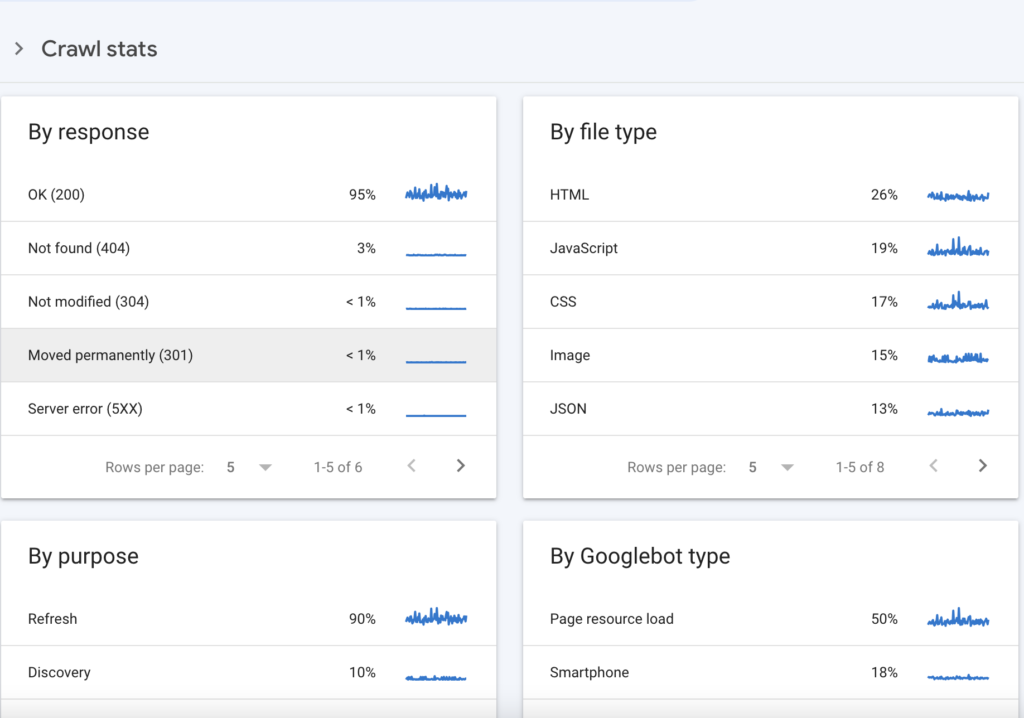
The crawl request breakdown section shows a detailed breakdown of the requests that Googlebot made to your website by filetype, by response, by purpose, and by Googlebot type.
.
- By response shows the different types of responses Google got while trying to crawl your site, clicking on each response will display a list of URLs that gave the response
- By file type: shows the various files that Google requested to crawl on your site and their response rates. This helps you understand the resource Google spends most time on, if it seems to be crawling your less valuable file that’s a good insight to work on.
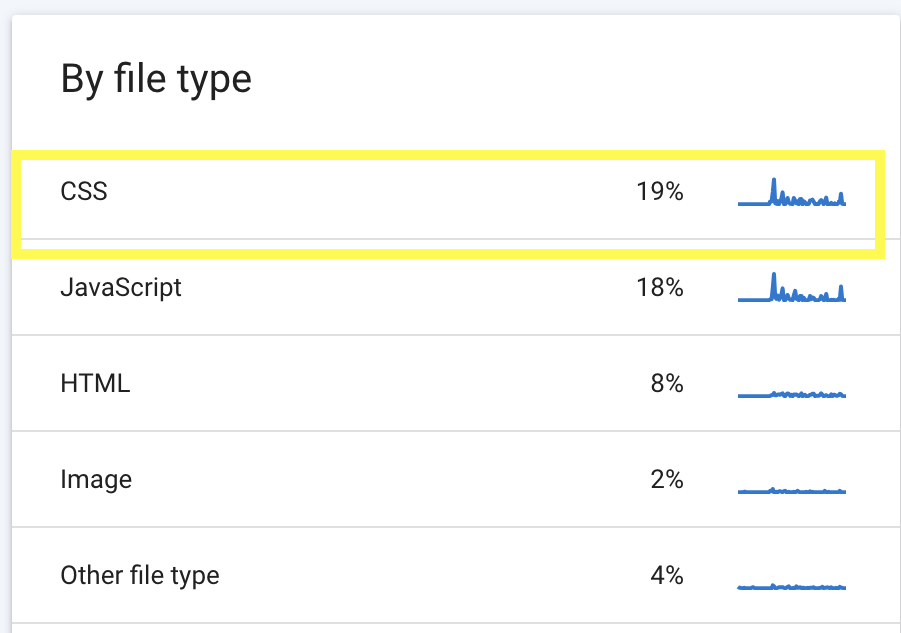
For example, CSS files are being crawled by Google more than other file types on this site. We can minify the CSS plugins to improve page load times and make it easier for Google to crawl.
You can click on each file type to reveal more details.
- By purpose: tells you if Google is recrawling your web page (Refresh) or crawling new pages on your site (Discovery).
- Refresh: Shows Googlebot visits a web page that has already been crawled. Google may refresh a page to see if:
- The page has been updated with new content.
- The page has been moved or deleted.
- Google has received a request to recrawl the page.
A high refresh rate could mean that your website changes frequently, this is often the case for News websites.
Discovery
When Google discovers a new page on your site, it means that Google has not crawled the page before. Google may discover new pages on your site through several ways, such as:
- Following links from other websites.
- Crawling your sitemap.
- Receiving a request to crawl the page.
Googlebot type shows you the different user agents that came to your site and the percentage of crawl requests they individually made.
This information can be used to identify specific pages or sections of your website that are being crawled more or less than you expect. However, Google Search Console (GSC) crawl stats provide limited data but in cases where your server logs are not easily accessible, GSC crawl stats can offer valuable insights.
How To Add Users to Your Google Search Console
There are many reasons why you might want to add users to your Google Search Console (GSC) property. For example, you might need help troubleshooting an issue, or you might want to share your data with someone else.
Follow these simple steps to give someone access to your GSC:
- Go to the Search Console website and sign into your account.
- Click on the Settings icon in the top right corner of the page.
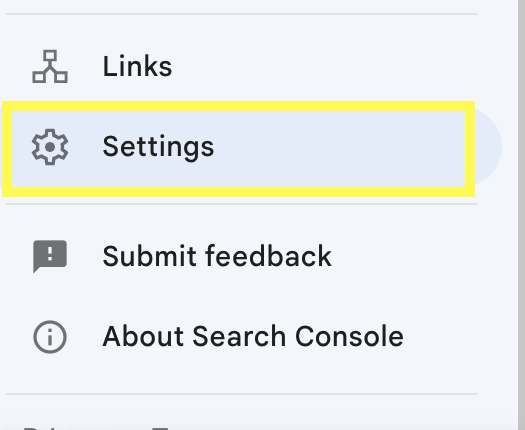
3. Click on the Users and Permissions tab.
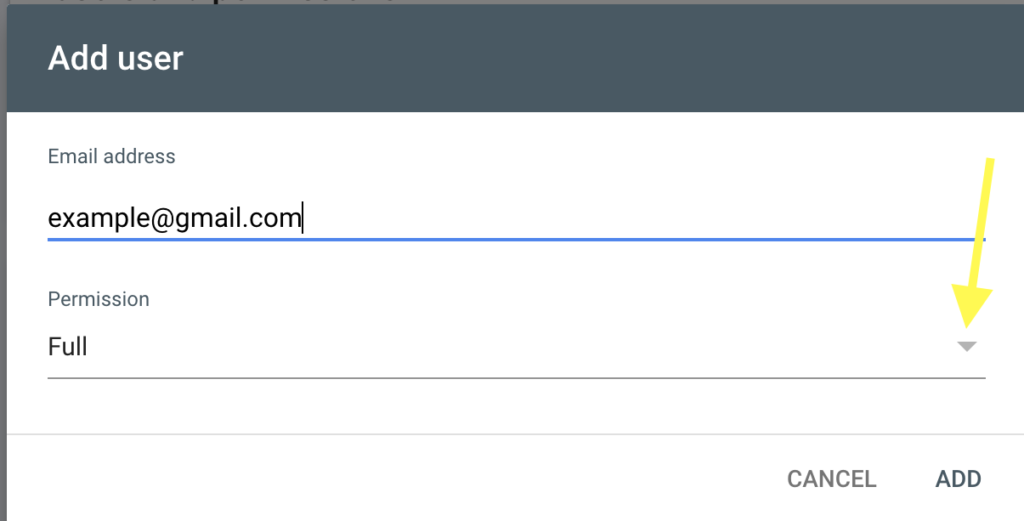
4. Click on the Add button.
That’s it, the new user can now see your property included in their GSC property tab.
What Next: Use Search Console to Keep Google’s Attention There are many tools that promise to analyze and improve your website’s search performance, however, Google Search Console remains an invaluable free resource.
Unlike other tools, Search Console grants you direct insight into how Google perceives your website, and allows you to gain a good understanding of your site’s strengths and weaknesses, enabling you to make informed decisions that will enhance its visibility.